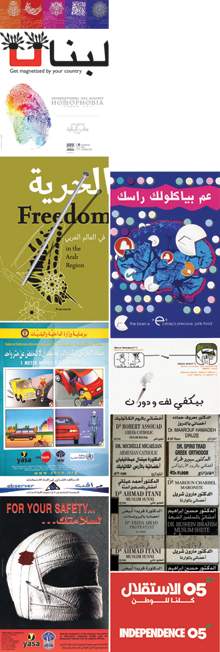
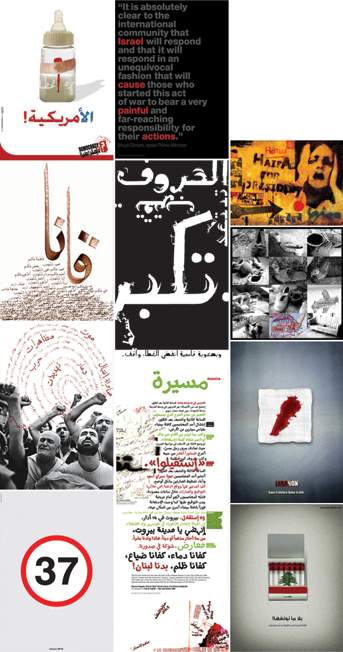
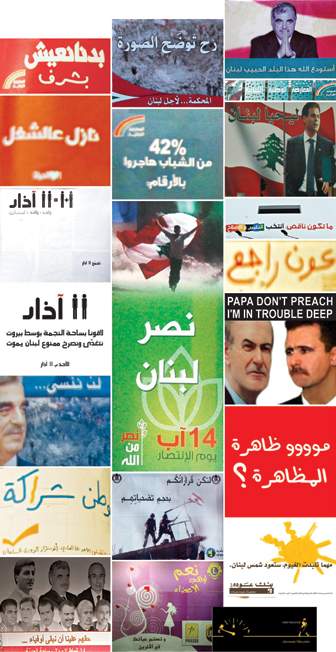
|
|||||||||||||||||||||||
|
MA Graphic Design
|
|||||||||||||||||||||||
|
|||||||||||||||||||||||
| Joanna Choukeir was born in Lebanon in 1982 in the middle of the Lebanese Civil War. She lived most of her childhood in Lebanon, and at the end of the Civil War, moved with her family to Washington D.C. where her father was sent on a mission at the Lebanese Embassy.
Back to Lebanon, Joanna completed her Secondary Education in Experimental Sciences at Saint Joseph School and her BA in Graphic Design at Notre Dame University, during the relatively peaceful gap of 1996 to 2004. For three years following graduation, she founded There for Design, a freelance design studio, was employed in the design department of Mediapak, Indevco Group, witnessed the 2005 serial bombings, participated in the 2005 serial demonstrations, backpacked around Europe by train and experienced the Second Lebanon War in 2006. Gradually, Joanna developed an interest in researching about the conflict in Lebanon through two areas that she had acquired most experience in: Design and politics. In 2007, she moved to London and completed her MA in Graphic Design with distinction, at the University of the Arts London. Her MA thesis, Visual Politics, is presented here. Moving on to PhD, Joanna is currently developing communication design methods for integrating youth groups from different social groups in Lebanon. She is also working as lead designer with Uscreates, a social design company in London, and assisting in the Learning Zone at the University of the Arts London. |
|||||||||||||||||||||||
 |
|||||||||||||||||||||||
|
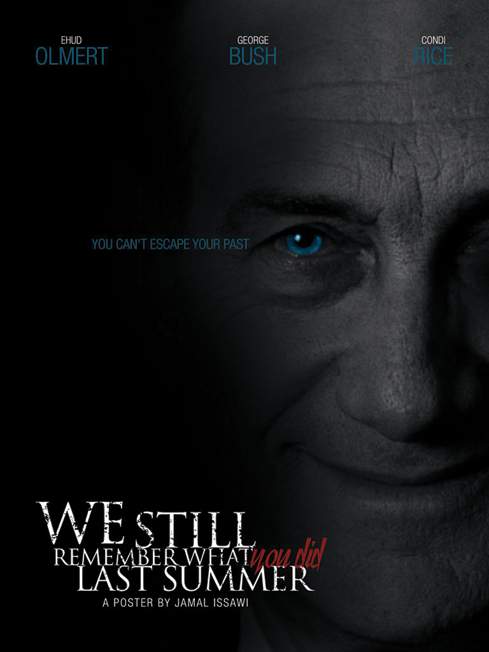
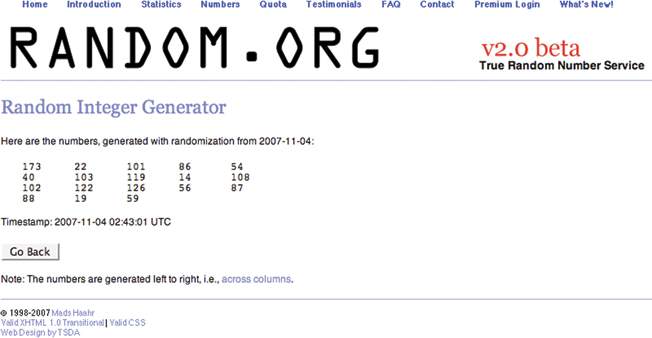
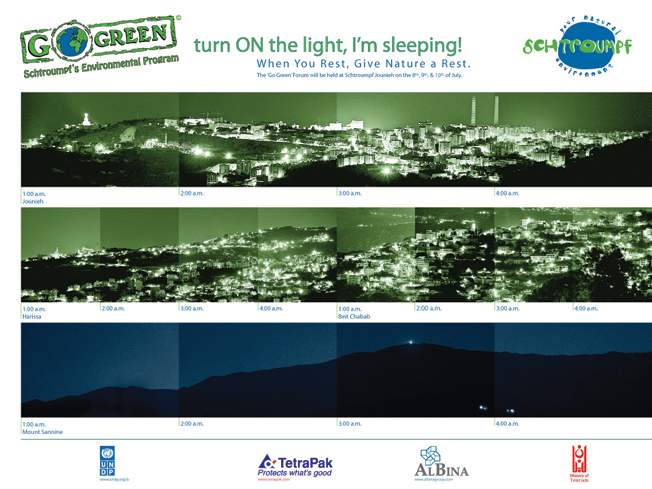
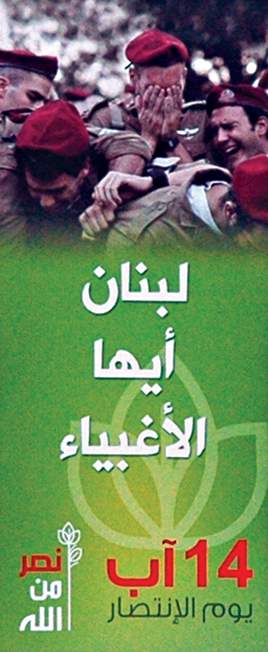
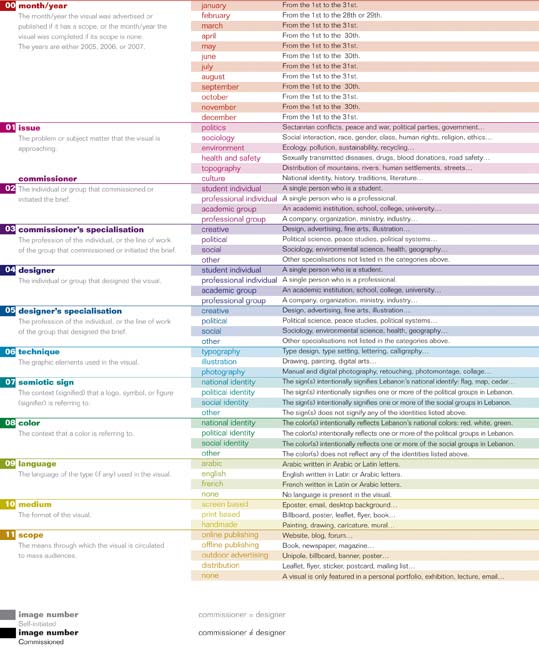
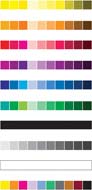
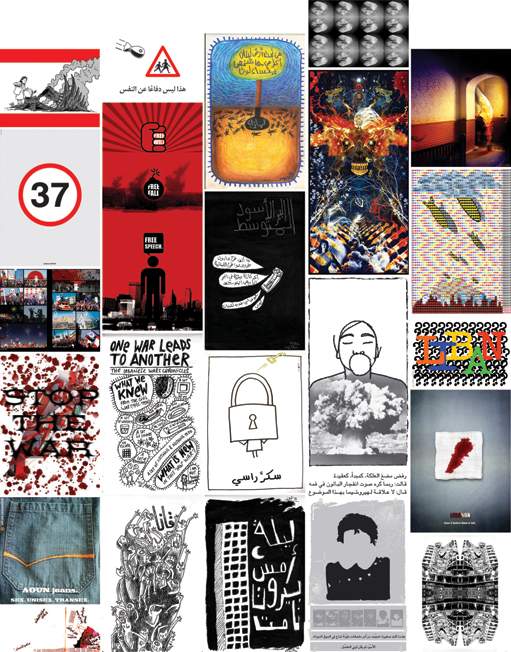
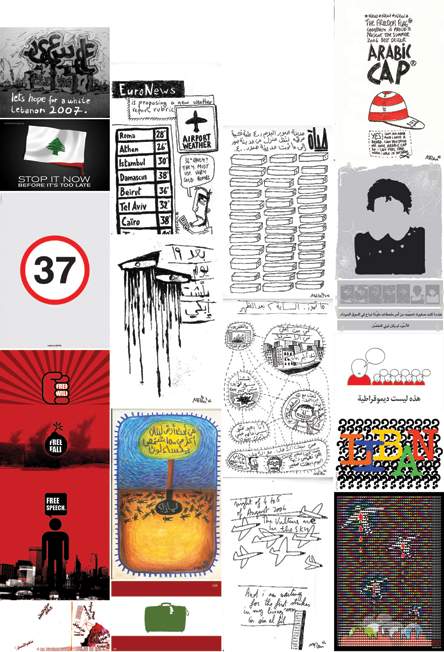
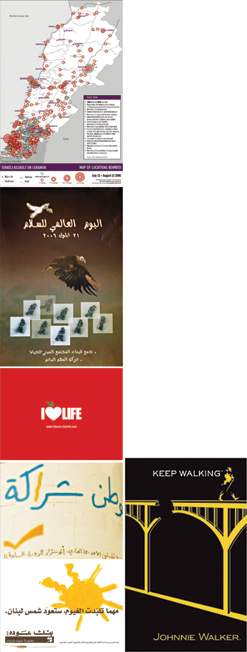
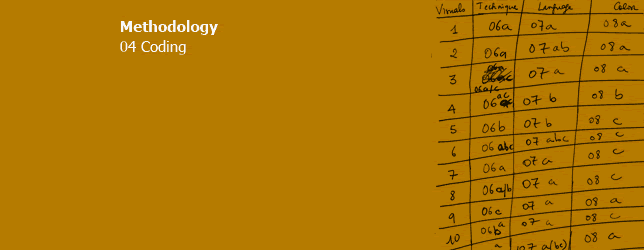
Coding is a system devised for documenting large amounts of information. 'When faced with a large number of images, their sheer richness is likely to be overwhelming'.[45] The role of codes is to transfer the meanings of an image into figures and symbols for quantification. Lutz and Collins[46] say that the process of reducing the richness of an image into a series of codes means that much will be lost. Nevertheless, the meaningful aspect of this process is that although codes don't replace the image, they can have analytical significance if chosen carefully. The process of coding is divided into various stages. These will be covered in the following sections. 4.1.0 Numbering At the initial stage, each graphic in the survey must be numbered from one onwards (the order of the graphics is unimportant). It can prove less confusing if the files are also named with their respective numbers. To keep incoming graphics under control, every graphic that was being collected from the survey methods was assigned a number from 001 for the least recent, to 180 for the graphic that was received last. 4.2.0 Variables The information questions from the survey methods are modified into variables. There are three conditions for developing the coding variables.[47] Exhaustive: Every aspect in the image relevant to the research question is covered by one variable. Exclusive: Each variable is self-contained so two variables cannot overlap. Enlightening: The variables breakdown the aspects of an image in an analytically interesting and The following variables were developed from the survey information list. Site of production Site of the image Site of audiencing 4.3.0 Labelling Each graphic should then be attached with a descriptive label containing all the answers to the different variables. This is an example of how labelling was applied to a graphic image figure 42. Number: 142 4.4.0 Missing information Labelling the graphics will uncover the problem of missing information. These gaps can seriously interfere with accurate results. There are two methods for dealing with missing information: Listwise deletion and pairwise deletion[48]. Listwise refers to the deletion of a whole variable because many of the graphics contain missing information in that field, and pairwise deletion refers to the temporary deletion of only a few graphics when their missing variable is being analysed. Using a sampling fraction to obtain a small sample is helpful for grouping information into categories. Attempting to find categories from the whole survey might be too demanding and confusing. The fraction is the ratio of graphics in the sample to the total graphics in the survey. A sampling fraction is usually between 10 and 25 depending on survey size. It is important that the sample is obtained from random sampling methods. When this is done, the researcher can look at all the answers in the sample that correspond to one variable, and then try to group them within as few categories as possible, without losing information that is purposeful for the investigation. This is done to all the variables, and the resulting categories can be tested on a second or third random sample to check if they apply to the answers in the variables. If they don't, then new categories need to be added, and if a variable ends up with too many categories, then these can be generalized and grouped together even more. In the case study, I relied on a sampling fraction of 10, and visited a random numbers website: www.random.org 014: The Red Cross 4.6.0 Code book Once the categories are working efficiently on several graphics, a code book can be assembled. The code book consists of the definitions of all the variables and all the categories within the variables, in addition to a specific shortcut symbol for each. The definitions of the categories do not have to be universal; they may only be limited to the context within which they are used, but this should be made clear. According to Rose[49] 'the coding categories must be completely unambiguous. They must be so clearly defined that different researchers at different times using the same categories would code the images in exactly the same way'. So the main purpose of the code book is to achieve replicability. This is an example of how the color variable was defined in the preliminary code book:
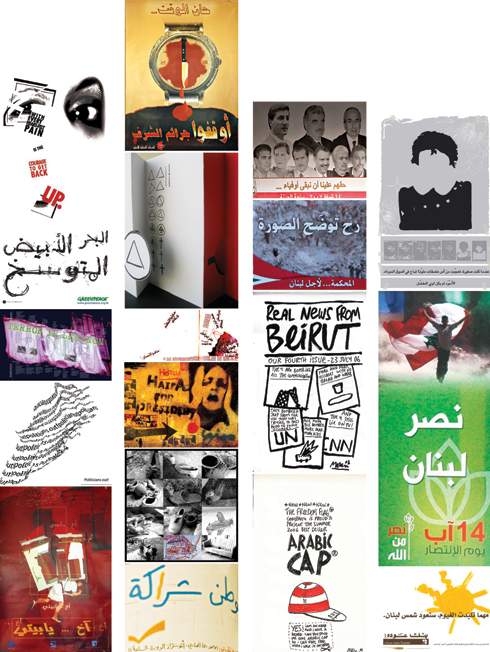
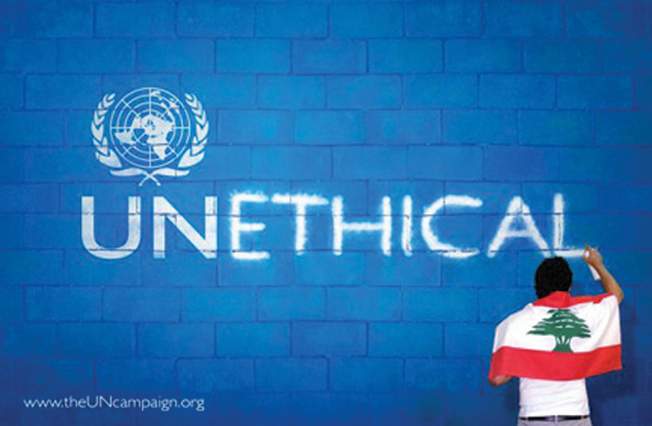
4.7.0 Pilot test Some pilot testing for the code book can guarantee that it is replicable. The pilot test ensures that two different researchers, with the same sample and code book, can achieve similar results. If they don't, then the categories may be ambiguous and in need of adjustment, and in the case where the graphic itself is ambiguous, the disagreements in the results can be discussed and resolved among the different researchers of the pilot test. This process of pilot testing and refining the code book should be repeated as many times as necessary, until the results are satisfactory. A preliminary code book was sent to two researchers along with the first sample of 18 graphics and the original answers to the variables. The researchers were asked to observe the graphics, and translate the answers into the list of codes from the book. The results were collected and compared to my personal results. All of the codes for the variables at the sites of production and audiencing were practically flawless. This is obviously because the researchers were only translating answers from the survey methods. One exception was with the issue variable. Deciding the issue relied on discourse analysis. The researchers were required to read the rationale of the project and decide which issue it approaches: 01 politics, 01b sociology, 01c environment, 01d health and safety, 01e topography, and 01f culture. The main flaw was that each category in the issue variable was not very clearly defined. For example, sociology was misinterpreted for social sciences, which is a field that can include political science, environmental science, geography, etc. while sociology is only restricted to human behaviours and interactions. Accordingly, the categories were redefined more clearly. A major difference in results was occurring at the site of the image because the codes were based on personal observation and interpretation of the graphic as a visual image. The two failing variables were technique and color. The former was defined as the 'dominating technique used to create the visual' and its categories were: 06a typography, 06b illustration, 06c photography, and 06d various (where two or more of the previous techniques are used equally throughout without any one dominating the other). The misinterpretations were caused by the word 'dominating' in the variable's definition, because in many cases, it is difficult to judge which technique is 'dominating'. The graphic in figure 45 is an example of one of these cases. I coded '06a typography' as the dominating technique while another researcher coded '06d various' because he considered that it contained an equal mix between photography and typography. A third researcher coded it as '06c photography' because he saw the photograph of an individual writing on a wall as the dominant technique. The only solution was to remove 'dominant' from the variable's definition, and allow combinations of techniques. When the second pilot test was conducted with a different group of researchers, they all successfully coded it as '06ac typography and photography'. As for the color variable, the term 'dominant' was also creating the same confusion, but that was not my main concern because there was a bigger issue. Is the research investigating what the color is: yellow, green, red, blue… or what the color is identifying with? If an environmental campaign figure 46 and a graphic identifying with Hezbollah figure 47 both use green, should they both end up in the same cell? For that reason, the color variable was redefined as 'the context that a color is referring to', and its categories were: national identity, political identity, social identity, and other. The new categories proved successful in a second pilot test. This continuous process of testing and tweaking helped develop the final categories that can be confidently applied on the complete survey of graphics. The code book is available in Chapter 2 of Volume 2 code book, and every graphic with its set of codes is reproduced in Chapter 3 of Volume 2. 4.8.0 Factorial design Before proceeding with coding the complete survey, it is helpful to test the number of categories by using factorial design. The factorial calculation verifies that the number of categories devised for coding is relative to the numbers of graphics in the survey. The formula of factorial design depends on how many variables the researcher intends to study in one relationship. If the factorial design proves that the survey size is smaller than the specificity of the categories allow, then some compromises need to be made so that the categories are fewer and more general. This investigation will study the crossover of only two variables at a time, to avoid the complications that arise from trying to understand the effects of more than two. So to do the factorial analysis, I chose the two variables that contain the highest number of categories, where the categories cannot contain blanks (so the month variable is excluded in this case). These two variables are issue with six categories, and scope with five. So if the investigation seeks ideally five graphics per cell, the factorial calculation will be:
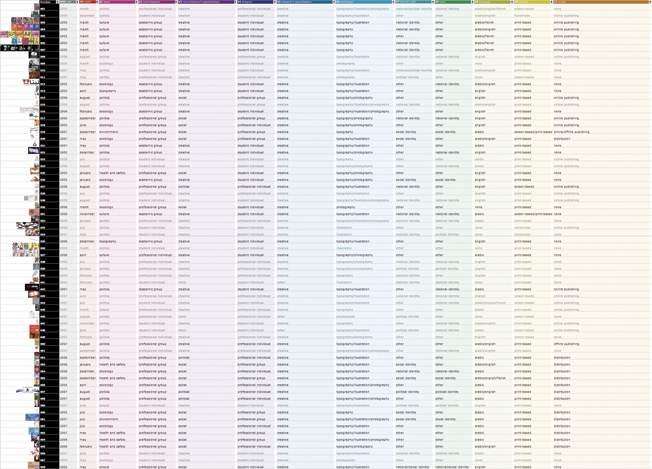
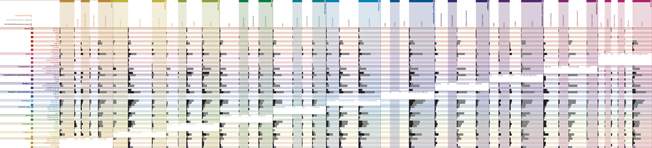
This means that the survey needs to contain at least 150 graphics for the number of categories to be valid. This is good enough because the original survey size is 180. 4.9.0 Database Data processing facilities are an important contributor to analysis. To cut down on time, coding the complete survey according to the code book can be done directly on a data-processing software. This offers a number of advantages such as error prevention – many database applications can detect errors if the code is alien to the assigned categories in a column – and filtering. The latter will be the most beneficial because it allows the researcher to filter information so that graphics that have at least one variable in common are grouped together. This method can also be very specific allowing the filtering of all the variables at once. I used Microsoft Excel to build my database. There are many more specialized statistical software pacakges but the constraint of time and budget obliged me to stick to the basics. Each variable was assigned a column, and each graphic a row. The variable columns were color-coded for easier browsing, and the rows differentiated the commissioned from the self-initiated graphics by coloring the codes in black or grey respectively. Each row is represented by a small thumbnail of the graphic it is representing for quick reference. The electronic database figure 48 is available as a CD insert in Chapter 4 of Volume 2. At this stage, the research has gone a long way, and all the results are right there in the database, but in codes and numbers. Although filtering allows groupings, it does not show each group in relation to the rest of the groups, so it obstructs comparison. In order to examine and analyse, the filtered information needs to be diagrammed, graphed or mapped. The next chapter will describe a mapping system that incorporates all the different variables and their crossover at once, thus assisting the researcher to visually understand the results. |
||||||||||||||||||||||
|
|||||||||||||||||||||||
 |
|||||||||||||||||||||||
|
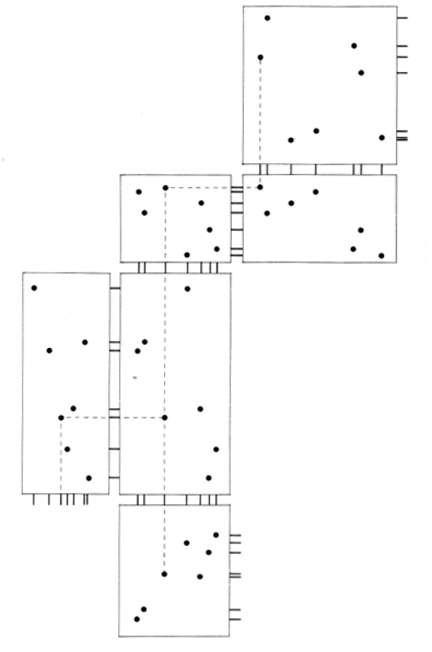
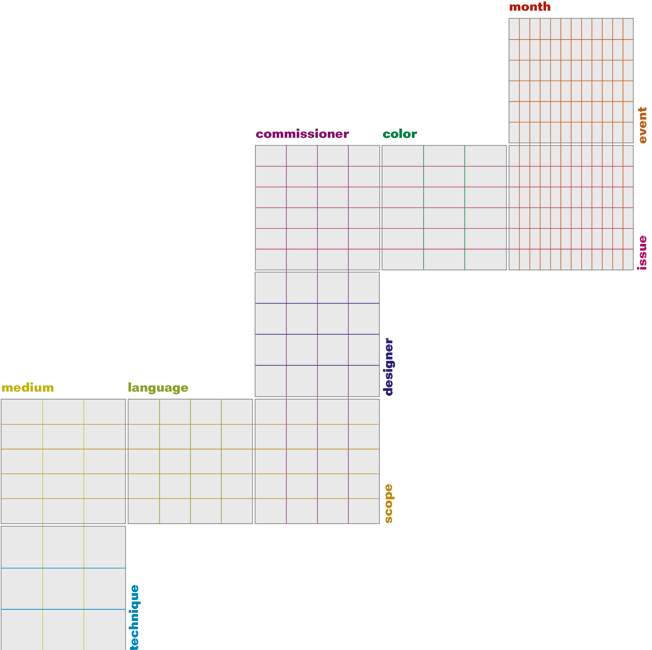
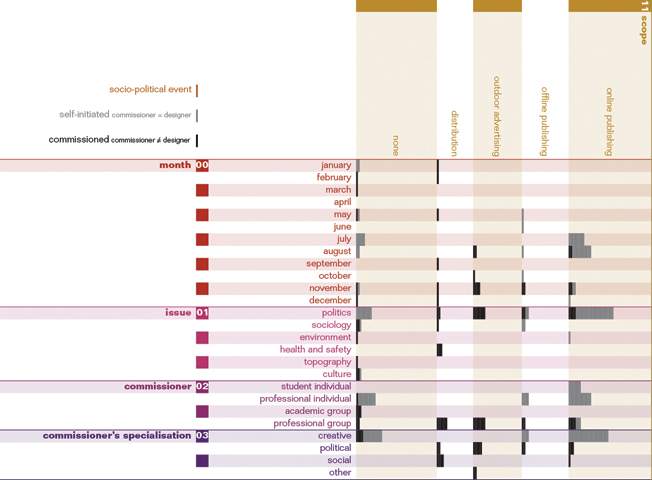
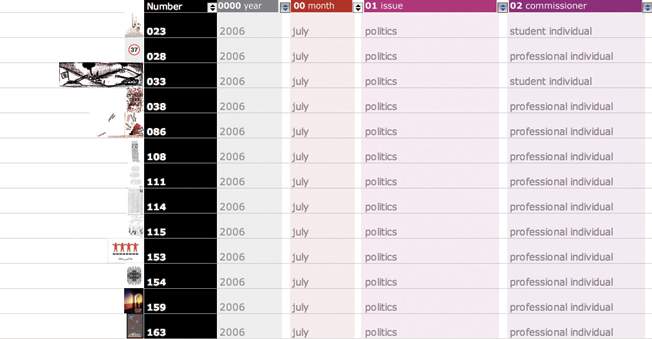
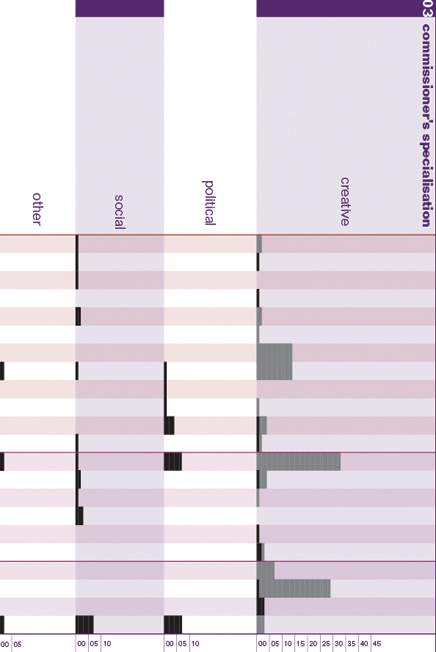
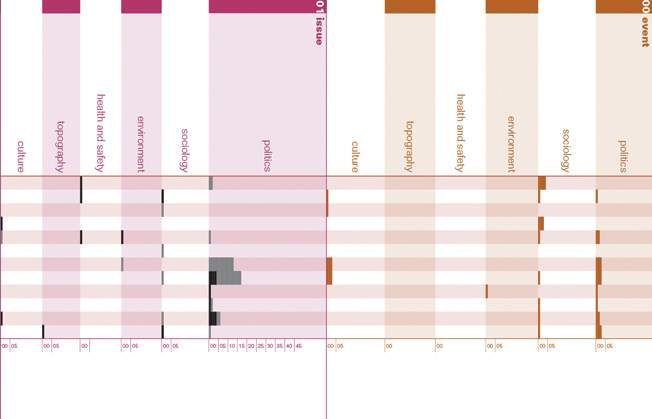
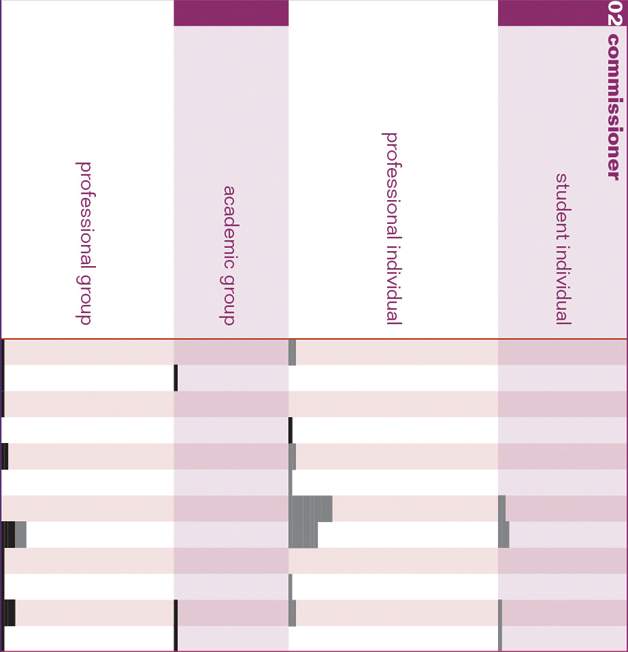
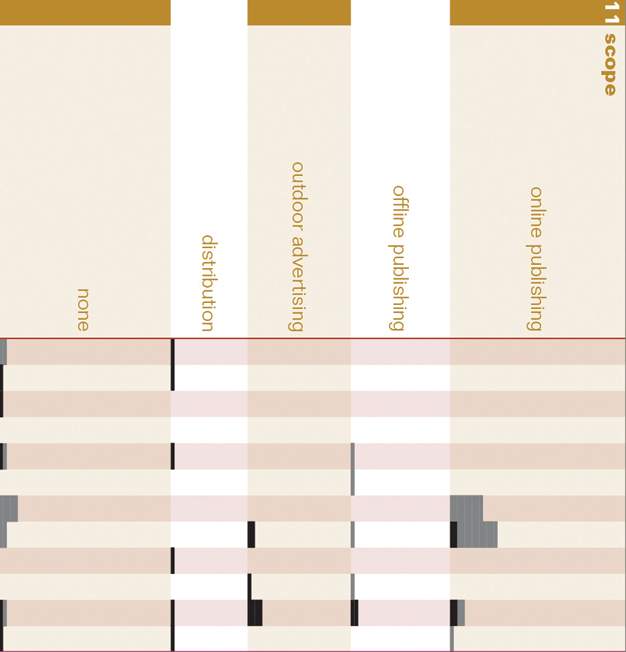
The purpose of presenting data visually is to assist in thinking and reasoning. In spite of this, visual representations can sometimes distort or obstruct evidence if they are not well considered, and therefore make the complete analysis incorrect despite the exactness of the data. Edward Tufte[50] describes some mapping flaws that may lead to this, such as chart-junk, low data-ink, low data-density, or multi-dimensional visual representations for one-dimensional data. He states that successful informative visual representations will exemplify six fundamental principles of analytical design.[51] These are indifferent to language, culture, time period or research question. 5.1.0 Multivariate analysis One of the principles of analytical design is multivariate analysis, which involves mapping the multiple conditions under which relations happen. Bivariate analysis is no longer persuasive because one variable rarely affects a second variable; the truth of the matter is that a whole series of variables affect a whole series of other variables in different ways. According to Tufte,[52] 'the only thing that is two-dimensional about evidence is the physical flatland of paper and computer screen.' Information is multivariate, and strategies of design should be able to show that. Multivarietness is nothing out of the ordinary. The first attempts of mapping out the database started with multivarietness as the ultimate objective. The database consists of 12 variables at the sites of production, the image and audiencing, and they all somehow relate to one another. The initial step looked at Tufte's[53] 'rugplots' figure 49. These allow the context of each graphic to be traced as it moves from one variable to another. So in the adaptation structure figure 50, the graphics can be analyzed according to month versus event then month versus issue. From there, it moves on to issue versus color and issue versus commissioner, then commissioner versus designer and commissioner versus scope, and so on. This is a very effective structure for studying the relationships between variables and their effects on the quantitative groupings of graphics, however it is only functional if the research question is seeking a very specific set of relationships. This is because the structure doesn't offer the possibility of studying the relationship between two variables that lie on the same axis, such as the relationship between issue and scope, because both are on the vertical axes. If scope is shifted on a horizontal axis, then it looses its connection with language, and the same happens in every case. Comparing self-initiated and commissioned socio-political graphics requires comparing every aspect of their different sites, which means every possible combination of their variables. Consequently, the rugplot was developed into numerous modules that eventually formed the complete crossover of all the variables on the x-axis with themselves on the y-axis figure 51. The diagonal overlaps were excluded; for example issue versus issue. This mapping structure offers the researcher the flexibility to study every single variable in relation to the 12 remaining variables. For example, one can study the frequency of graphics divided into their different scopes, in relation to the dates when they were produced, the issues they approached, the commissioners who initiated them and their specialisations, the designers who designed them and their specialisations, the techniques used to produce them, etc. The final mappings are a series of three, one for each year: 2005, 2006 and 2007. It would be insignificant to mix the three years into one mapping because information would be lost in all the variable crossovers that are independent of time. The real-scale foldout mappings are available in Chapter 5 of Volume 2. 5.2.0 Comparison Another principle of analytical design is comparison. All quantitative reasoning is based on one question: “Compared with what?'[54] In order to understand the meaning of a group's quantity, it should be compared to another group's quantity, and that was the main limitation of interpreting results from the database. The aim of the comparative research question was converted to a third variable in the mapping. Black bars represent commissioned graphics (commissioner is not the same person as the designer) and grey bars represent self-initiated graphics (commissioner and designer are the same person) figure 52. So within the variable crossover, there is an additional layer that shows a direct comparison between the frequency of commissioned and self-initiated graphics. This is the main visual aspect of the mapping that contributes to the analysis of how these two differ. 5.3.0 Documentation The credibility of a visual representation is dominated by the principle of documentation. It is 'an essential mechanism of quality control for displays of evidence'.[55] It should be possible to trace back the visual evidence to its original information source in the database, and the evidence must be supported by scales of measurement. To trace back each bar column to the database, it is enough to filter the two categories that it crosses in the mappings. This will result in a list of numbered thumbnails that represent the content of the bar figure 53. In the mappings, a 0.5 mm dash stands for one graphic and each sub-column has a measurement ruler that counts the frequency of graphics in increments of 5 figure 54. The ruler goes as high as the highest frequency in that sub-row to give a rounded comparison between frequencies of different categories in a variable. 5.4.0 Content Just as it was fundamental to include every graphic from the survey methods for the content to be representative, so must be done with mapping. 'Analytical presentations ultimately stand or fall depending on the quality, relevance, and integrity of their content'.[56] Thus, every single piece of information available in the database must be mapped irrelevant of personal expectations from the results. 5.5.0 Integration of evidence Analytical graphics should integrate many modes of evidence if relevant to the investigation. Tufte[57] stresses that an excellent map will have words, numbers, line-art, grids, measurement scales, and whatever is useful for 'making sound inferences'. While studying the context of the Lebanese society, I recorded the major socio-political events that occurred between January 2005 and September 2007, and mapped them in a timeline (Chapter 6 of Volume 2). I have already established in the contextual overview that these visuals occur as a response to the daily events that take place in a particular culture. So studying the relationship between events and the issues that the graphics were confronting will give some enlightening information. To integrate this evidence in the mapping, it must have a common variable with the graphics, and this is 'time'. A separate column was incorporated which crossed over with month only. The different events were coded according to the same issue categories as the graphics: politics, sociology, environment, health and safety, topography and culture. All assassinations, bombings, elections, resignations, wars, etc. are categorized as politics, religious and social public holidays are categorized as sociology, environmental disasters as environment, diseases and accidents as health and safety, constructions or destructions as topography, and cultural events and festivities as cultural. Mapping this information allows a direct analysis between the frequency of events and graphics according to their issues figure 55. 5.6.0 Causality When the relationship between different variables is under study, new meanings can emerge from the quantitative results, and these are based on the fundamental principle of causality. In that manner, a descriptive quantitative study of 'how many' can lead to analytical studies of 'why'. Tufte[58] suggests that 'simply collecting data may provoke thoughts about cause and effect.' Examples of causalities that the mapping is demonstrating are between the commissioner and scope. Almost all the graphics that were self-initiated are a result of individual effort, while all the graphics that were commissioned are produced by groups figure 56. Furthermore, the majority of self-initiated graphics either has a non-mass scope, or is published online, while commissioned graphics are mainly advertised, or distributed figure 57. The following chapter will serve as a qualitative analysis of frequency in the mappings to seek answers to the initial research question. The analysis will study causality and comparison in more detail, and draw general conclusions about self-initiated and commissioned socio-political graphics. |
||||||||||||||||||||||
|
|||||||||||||||||||||||
 |
|||||||||||||||||||||||
|
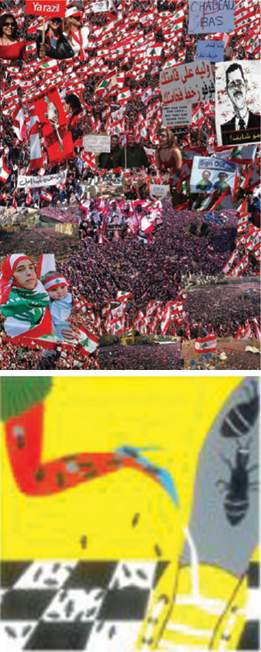
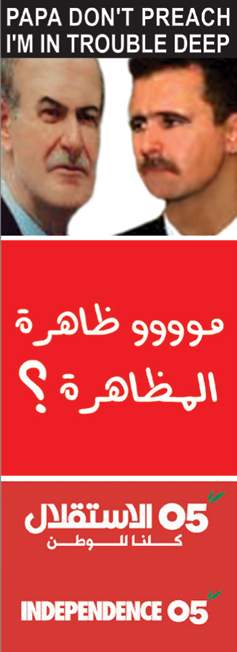
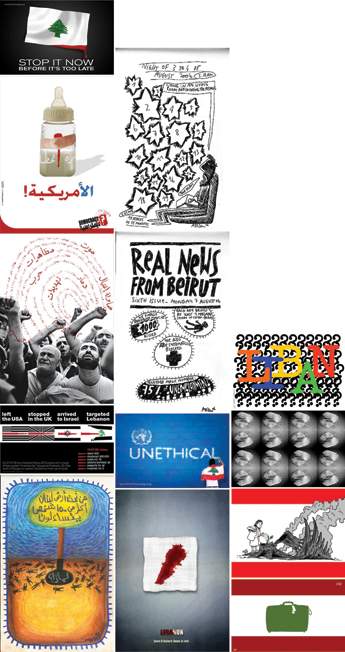
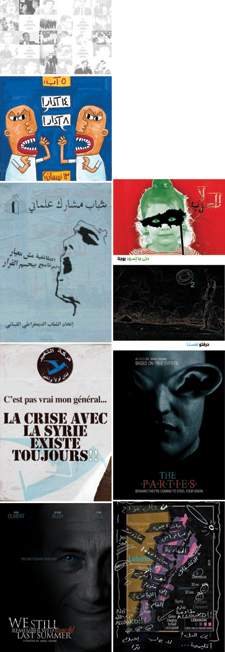
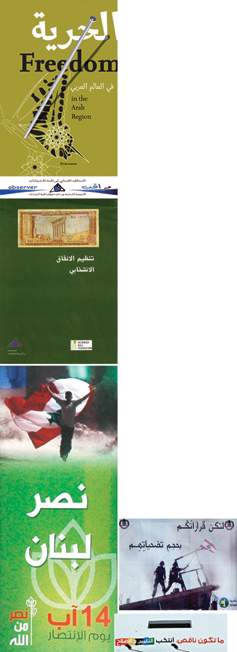
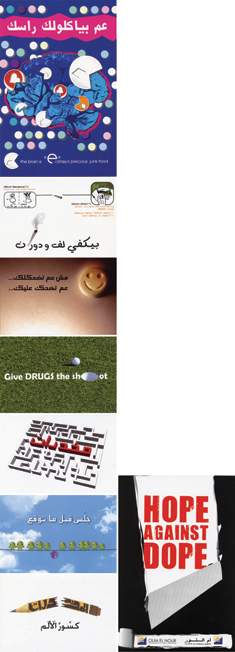
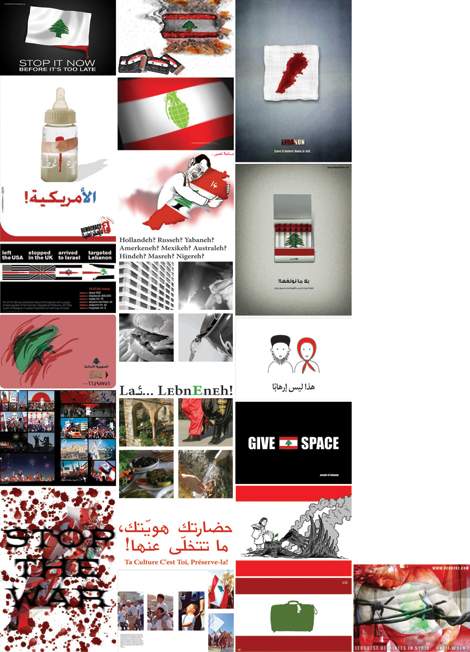
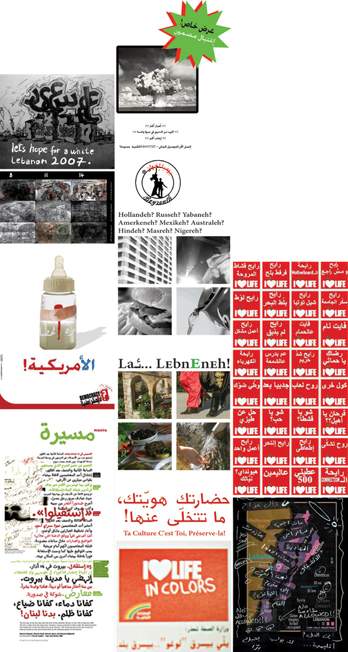
After having followed an extensive process from the research question, to the context, survey, coding and then mapping, and after having avoided the major pitfalls of research design in every step, it is finally possible to reach the phase of analysis and be assured that the drawn conclusions are general and representative. Rose[59] explains a quantitative method as 'a technique the results of which need interpreting through an understanding of how the codes in an image connect to the wider context within which that image makes sense.' Therefore, at this stage, the researcher can take the time to look at the frequencies in the mappings, interpret what they are revealing, and comprehend them within a larger contextual understanding of the subject. The mappings communicate a number of layers of information. Understanding can happen either at a univariable or a multivariable level, which in this case means 366 tables. This is inevitable in analysis because even such a large number of tables may only offer a few interesting results, and these can only be valid if the frequency differences are major. Minor differences are insignificant for drawing conclusions, because the survey is only showing a sample of all the Lebanese socio-political graphics that were done between 2005 and 2007. However, it is important to mention that commissioned graphics may be more representative than self-initiated graphics since they cover a higher percentage of the total campaigns that were produced. This is because they were retrieved from secondary sources that hopefully archived all the major campaigns. Oppenheim[60] writes that there is no end to multivariable analysis, and most surveys will never be completely 'analysed-out', but it is important to keep this question in mind when analysing frequencies: 'Is this table really necessary?' The following frequency analysis will dissect each variable at a time in relation to a selection of multiple variables depending on the most interesting results, i.e. when differences in frequencies are high, or when there's practically no difference at all. Analysis could have been divided for each year separately, however, since three years is not a large time gap, the analysis will go through them simultaneously while highlighting the years when there is a noticeable exception. The analysis will move from the event and issue columns to the medium and scope columns at the end. Volume 2 should be referred to for a clearer understanding of the analysis (electronic database in Chapter 4 and/or mappings in Chapter 5). 6.1.0 Event date and issue These variables refer to the socio-political events in relation to the issues that the graphics touched on. In 2005, the highest number of graphics was generated during the months of February, March and April, mainly with politics as an issue and almost equally between self-initiated and commissioned graphics figure 58 & figure 59 . These were all relational to the massive demonstration on the 14th of March in Martyr's square. The political groups that were commissioning the graphics were not part of the government at the time, and they subsequently sided with the protestors. In 2006, a very high frequency of graphics was produced in July and August 2006. Their issue was politics, and they were vastly dominated by self-initiated graphics protesting against the July War figure 60 & figure 61. In 2007, the majority of graphics was political as well, mostly in January, and May to September. Self-initiated graphics were generated with almost equal frequencies in May, June, August and September, and they dealt with a diverse range of issues from sectarian conflicts, to terror bombings, by-elections, and lamentations over the memory of the July War. The highest frequency of commissioned graphics was limited to the month of August, generally promoting specific sides for the August by-elections figure 62 & figure 63, except for Hezbollah that was reviving its victory in the July War. This is mainly because the Shiites were not involved in the elections. The purpose of the by-elections was to replace two members of parliament that were assassinated (Pierre Gemayel and Walid Ido), so the two seats were reserved for a Maronite and a Sunni, and the Shiites didn't feel concerned with this particular event. The issue variable showed that throughout the three years, politics was very major, and was approached by both the commissioned and self-initiated graphics. It was interesting to note that although their messages were not parallel, they both generally responded to the same events, this is why their highest frequencies almost always overlap in the same months. The other issues such as sociology, environment, health and safety, topography and culture recorded very low frequencies, except for June 2007 when many commissioned graphics were generated on Health and Safety. On closer inspection figure 64, June coincides with the International Day against Drugs, and Oum el Nour, a rehabilitation centre in Lebanon, had commissioned a large number of college students to design postcards for the event. 6.2.0 Commissioner and specialisation The commissioner is defined in this research as the individual or group who commissioned or initiated the brief. A very interesting result in this variable is that all the graphics were separated almost perfectly between self-initiated in the student and professional individual categories, and commissioned in the academic and professional group categories. This proved the general assumption that individuals generate the self-initiated graphics, while groups generate the commissioned graphics. The frequencies in the categories differ between 2005 and the remaining years. In 2005, academic and professional groups were commissioning with an almost equal frequency, while the student individuals were generating a slightly higher frequency of graphics than the professional individuals. In 2006 and 2007, the commissioner with the highest frequency of commissioned graphics was the professional group, and for the self-initiated it was the professional individual. Almost all of the professional groups were political or social figure 65, while the academic groups, and the student and professional individuals were creative. The results showed that creative individuals were producing even more graphics than social and political groups figure 66. 6.3.0 Designer and specialisation Creative academic groups are encouraging students to react to socio-political events, by commissioning college briefs that relate to contemporary Lebanese issues figure 67. Social and political professional groups are mainly commissioning creative professional groups to design the graphics figure 68. As for self-initiated graphics, they are designed by the commissioners themselves i.e. student and professional individuals who are almost exclusively specialised in creative mediums. Such an analysis implies that the leading generators of self-initiated socio-political graphics in Lebanon are creatives figure 69. 6.4.0 Technique There was no noticeable difference in the techniques that self-initiated and commissioned graphics used, even when compared with the issues they were communicating. They both relied heavily on typography and a combination between typography and illustration figure 70 & figure 71. Little use was made of photography except in 2005, when it showed higher frequencies than illustration. During that year, the combination of typography and photography was the most prominent graphic technique. 6.5.0 Semiotic sign and color In this study, the semiotic sign is defined as the context (signifier) that a logo, symbol, or figure (signifier) is referring to, and color as the context that it is revealing. They are both composed of the same categories: national identity, political identity, social identity and other. The two variables are completely independent because graphics may use a political identity's color, but not its symbol, or vice versa, or they may both be used simultaneously. The results show that social identity was a minority, and it was shown through both the semiotic signs and colors. The commissioners of graphics depicting social identity were almost entirely social groups. More than half of the graphics did not rely on any recognised national, political, or social identity, thus they were coded as other. The remaining graphics were distributed mainly between national identity and political identity in both their semiotic signs and colors. The majority of self-initiated graphics represented national identity using signs and colors figure 72, while commissioned graphics relied on national colors but incorporated political signs into their graphics, thus giving the notion that their political standing is 'national' figure 73. In 2007, the same direction was noticed with self-initiated graphics, but the reason for that was that many protestors in that year created parodies on the government's 'I Love Life' campaign figure 74. So these frequencies were a result of self-initiated graphics using the same visual language as commissioned graphics for ridicule. 6.6.0 Language Most of the socio-political graphics were mainly in Arabic, English or bilingual Arabic and English figure 75 & figure 76. Very few used French or didn't use language at all in communicating their messages. Same with technique, the results didn't show any correlation between self-initiated and commissioned graphics, and language. Both used English and Arabic almost equally with an increase in the frequency of Arabic in 2007, as issues of globalization and disappearance of national identity are becoming more popular. 6.7.0 Medium and scope Print-based mediums had radically higher frequencies than screen-based or handmade mediums for both self-initiated and commissioned graphics. In 2007, some slight increase in screen-based and print-based mediums was seen for self-initiated graphics. It is intriguing that although many graphics were produced for print-based purposes, they ended up being circulated through online publishing. This mainly applies to self-initiated graphics. Their frequencies were almost entirely distributed between a non-mass scope, and online publishing possibly because of no or low budgets figure 77. Commissioned graphics relied heavily on distribution, which can be quite costly due to printing large quantities, and outdoor advertising which is the second most expensive circulation method after broadcasting figure 78. It was unexpected that offline publishing was not a common circulation method considering the large number of newspapers, magazines, and books published every year in Lebanon, but the reason could be that publishers are more interested in publishing verbal rather than visual socio-politics such as articles, essays and reviews. This analysis draws some general and broad conclusions on the differences and similarities between self-initiated and commissioned Lebanese socio-political graphics. The most critical result the study exposed was that both use similar techniques, semiotic signs, colors, languages and mediums to communicate their messages. Therefore, to an external onlooker, the two look quite identical, because all of their common variables are dominated by the site of the image. However, what differs needed deeper analysis and examination, as it is not obvious on the external surface. The two diverge significantly with variables of the sites of production and audiencing, such as issue, commissioner, designer and scope. The last three were distinctively obvious from the mapping, while the issue variable was more discreet. This is because the majority of both categories approached the same political issues during the same periods of time, but when the graphics were traced back, they disclosed that the messages were quite contradictory despite discussing the same issues. Self-initiated graphics had more direct, blunt, harsh messages that mock, criticize and parody those of commissioned graphics. The implications of this observation are that the issue variable needs to include categories that are more specific, possibly all contained within politics because from the results, it was evidently the most significant issue. There were few previous studies on Lebanese socio-political graphics, so this research needed to be more descriptive than analytical, in order to gain a clearer understanding of the material's aspects. Now that the differences between self-initiated and commissioned graphics are clear, the research may be refocused towards analytical design to study a wider range of variables and categories within the sites of production and audiencing. Dr. Adonic Bouhatab suggested that collecting particular information on the site of production, such as the political or religious standing of the commissioners might lead to a representation of the Lebanese social structure, through socio-political graphics. I believe that inquiry on the rhetorics behind the messages may also be fruitful because it will dissect messages deeper than the issue variable allows. The end of every methodology poses new investigations and each investigation brings the researcher a few steps closer to a candid answer. The frequency analysis that was done for the case study reveals meaningful information, but it does not replace the statistical analysis that professional software packages can offer. The culmination of every research is in conducting statistical analysis because it can find correlations between different variables that are statistically significant. The software, unlike a human brain, can find and compare connections between all the different variables, extract the meaningful information, and save time for the researcher to focus on the important numbers rather than attempting to pin out haphazardly interesting results from a complex web of information. |
||||||||||||||||||||||
|
|||||||||||||||||||||||
 |
<< Methodology [2/3] | Conclusion, Review and Bibliography >> Joanna Choukeir
|
||||||||||||||||||||||
|
©////o/ |
||||||||||||||||||||||
|
|