|
|||||||||||||||
|
MA Graphic Design
|
|||||||||||||||
|
|||||||||||||||
| Joanna Choukeir was born in Lebanon in 1982 in the middle of the Lebanese Civil War. She lived most of her childhood in Lebanon, and at the end of the Civil War, moved with her family to Washington D.C. where her father was sent on a mission at the Lebanese Embassy.
Back to Lebanon, Joanna completed her Secondary Education in Experimental Sciences at Saint Joseph School and her BA in Graphic Design at Notre Dame University, during the relatively peaceful gap of 1996 to 2004. For three years following graduation, she founded There for Design, a freelance design studio, was employed in the design department of Mediapak, Indevco Group, witnessed the 2005 serial bombings, participated in the 2005 serial demonstrations, backpacked around Europe by train and experienced the Second Lebanon War in 2006. Gradually, Joanna developed an interest in researching about the conflict in Lebanon through two areas that she had acquired most experience in: Design and politics. In 2007, she moved to London and completed her MA in Graphic Design with distinction, at the University of the Arts London. Her MA thesis, Visual Politics, is presented here. Moving on to PhD, Joanna is currently developing communication design methods for integrating youth groups from different social groups in Lebanon. She is also working as lead designer with Uscreates, a social design company in London, and assisting in the Learning Zone at the University of the Arts London. |
|||||||||||||||
 |
|||||||||||||||
|
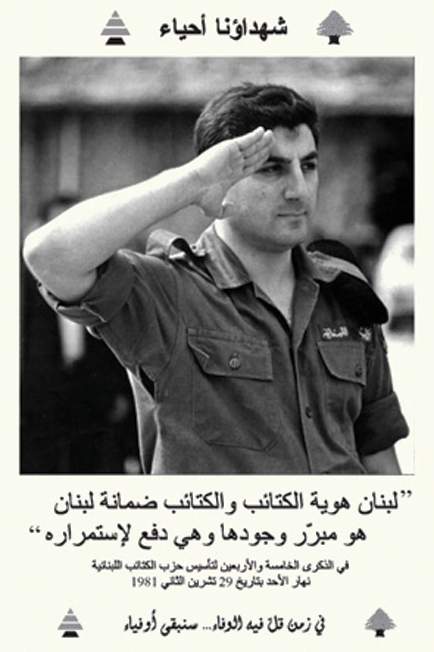
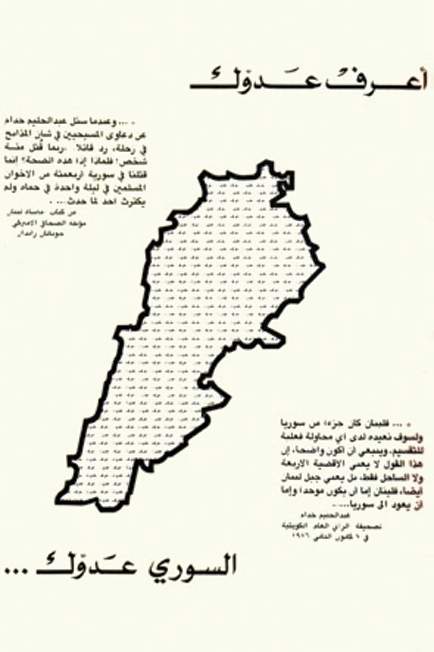
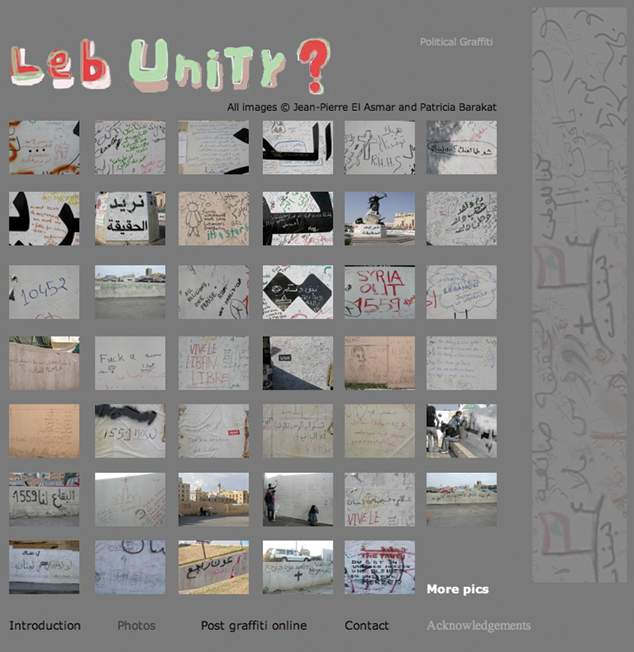
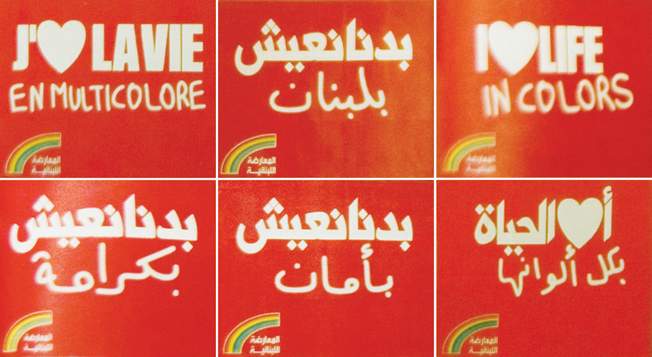
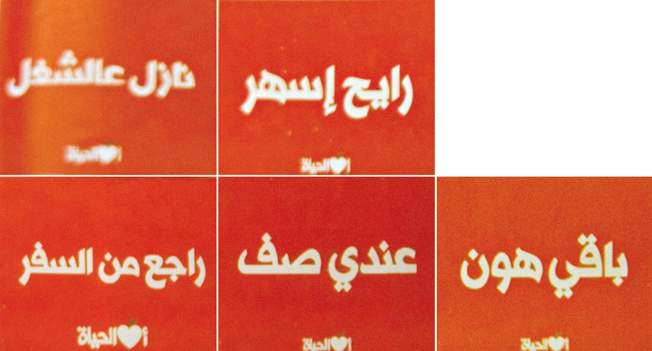
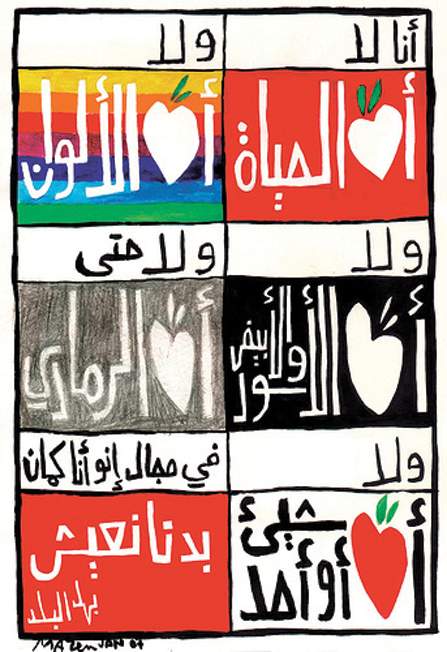
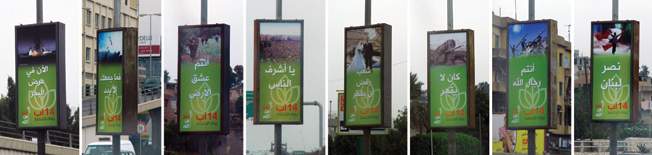
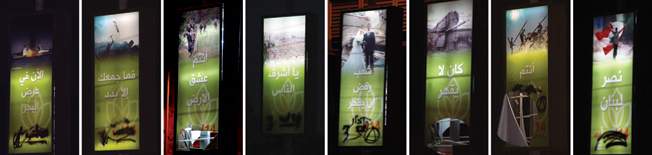
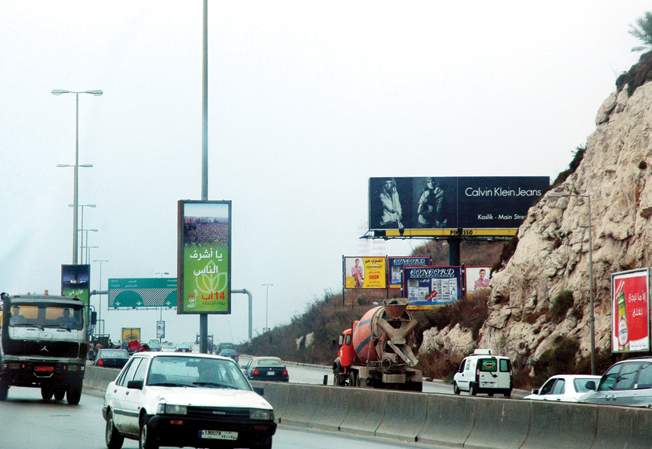
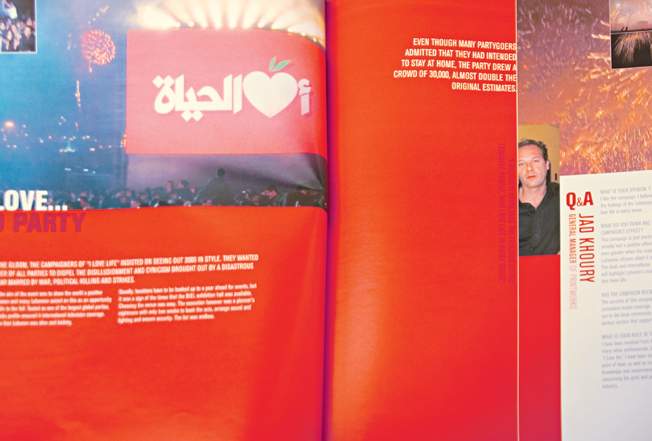
It may seem tempting and exciting to put together a collection of haphazardly found socio-political graphics for analysis, but the gathered sample will not be representing anything more than itself. No conclusions can be drawn from it, and the whole analysis will be relying on invalid evidence. The correct procedure always starts with identifying the problem and forming a research question. The soundness of the problem is usually a hypothesis based on personal experience. At this stage, it would be necessary to review relevant researches that have attempted to study similar problems, in order to find potential directions worth exploring. The next step after concentrating the problem is establishing a research question. The more focused the research question, the easier it will be to prepare the appropriate research design for answering that question. Oppenheim[25] defines research design as 'the basic plan or strategy of the research, and the logic behind it, which will make it possible and valid to draw more general conclusions from it. Thus, the research design should tell us how our sample will be drawn, what sub-groups it must contain, what comparisons will be made… and what variables will need to be measured…’ By pursuing this progression, the theoretical aims of the research can be turned into operationalized procedures. 1.1.0 Hypothesis The study of Lebanese socio-political graphics started with a hypothesis based on personal experience: Having lived in Lebanon, the US and the UK and traveled around Europe and Asia, I came to recognize the distinction between a stable society, and a society that suffers from economic, social and political dilemmas. Having studied and practiced in different facets of graphic design, I found a great opportunity in using this as a tool for analysing Lebanese socio-politics. It is a study that remains highly overlooked in Lebanon, and I believed that investigating it may contribute to a certain social development or enlightenment. 1.2.0 Research review Because the problem was very broad, concentrating it entailed reviewing previous researches. According to Liz McQuiston, there are two sides of socio-political graphics 'broadly categorizable as establishment forces vs. unofficial agitators… establishment forces usually have the advantages of money and distribution, populist forces are fueled by personal commitment and solidarity.' The official voices usually belong to governments, leaders, and institutions that operate systems of control and define societal values and priorities, while the unofficial voices belong to those who question, criticize and reject societal values and priorities. In her book, Graphic Agitation, McQuiston displays graphics from both the official voice of the establishment as well as the unofficial voice of dissenters and agitators, for 'both are part of the political landscape and exert an influence over society's attitudes and opinions, and both belong to an on-going context of power struggles.' Rose[26] also accentuates the importance of understanding forms of representation produced by specific scopic regimes because they are intimately bound into social power relations. Donna Haraway's[27] project for instance studies dominant visuality that is categorized according to the hierarchies of capitalism, colonialism and patriarchy. She insists that the dominant visuality denies the validity of other ways of visualizing social difference, and she is interested in visuality that shows social difference in non-hierarchical ways. 1.3.0 Focusing the problem The review showed a connection between these general theories and socio-politics in Lebanon. 'National politics of virtually any country comprises a mass of internal power struggles’,[28] and in Lebanon this was particularly evident. Alya Karame and Zeina Maasri for example, are two Lebanese researchers working on 'Signs of Conflict’, an archive of the visual tools used by political parties during the Lebanese Civil War. Their research is showing that the political parties relied heavily on socio-political graphics as tools of propaganda figure 13 & figure 14. The posters and leaflets were not necessarily consciously designed, and a designer was rarely involved in the process, nonetheless, they were an integral part of communicating beliefs to the public. On the other hand, Patricia Barakat – El Asmar,[29] a Lebanese visual communicator, studied a collection of 455 photographs of graffiti figure 15 taken between February 2005 and May 2005, after Former Prime Minister Rafiq Hariri’s assassination. The aim of her research was to analyse people’s communication of 'worries, desires, political interests, frustration and taboos’ through graffiti. Her research contrasts with Karame’s and Maasri’s in that it looks at the unofficial voice of the public rather than the official voice of the establishment. Through daily observation of Lebanese socio-political graphics, I noticed some more evident examples of the conflict between these two voices. Shortly after the end of the July War in 2006, a campaign designed by Saatchi & Saatchi Beirut was released figure 16: 'I Love Life’, 'J’aime la Vie’, 'Ouhibou al-Hayat’, in three languages. People guessed that government allies were fueling it to ridicule the assumption that Hezbollah 'love death’. The government opposition soon replied to the campaign by using the same visuals with an added graffiti-like message under the 'I Love Life’ slogan figure 17: 'without debts’, 'in multicolors’, 'with my head up’… to trigger the failure of the present government in answering people’s needs. A few weeks later, the government allies had their own hit-back 'I Love Life’ campaign figure 18: 'I want to go to work’, 'I have class’, 'I am coming back to Lebanon’… encouraging people to keep faith and go about their daily lives despite the situation. Therefore it became obvious that ad spaces on the Lebanese highways altered from brand advertisement to an incredibly expensive chatroom for political parties. What was unforeseen was the response of the public to the campaigns. Spoof ads started to emerge at an alarming rate figure 19, each campaign criticizing one political party or the other, and sometimes even both simultaneously. Individual dissenters were producing the visuals and circulating them massively through the cheapest medium, the Internet. One of the most intriguing of these was a perfect replica of the government’s second 'I love Life’ campaign figure 20. It included identical copy writing in addition to a parody below it: 'I want to go to work for £100 a month’, 'I have class but I can’t pay for the tuition fees’, 'I am coming back to Lebanon to take the family’… Another slightly different incident happened in August 2007. Hezbollah displayed a large series of sequential banners figure 21 between Metn and Keserwan – both Christian districts – that celebrated the anniversary of their victory over Israel in August 2006. This time the public voice found another means to respond to the campaign. When night fell, Hezbollah oppositionists attacked the banners, burned them and distorted their messages with graffiti figure 22. Every few days, the banners were replaced with newly printed ones, and the same detrimental reaction would happen over and over again. The voice of the political party was persistent, and so was that of the agitators. 1.4.0 Research question Daniel Drennan[30] conceded the difference between these two voices in Lebanon: “Two conversational spaces have mixed, if not melded, with corporate messengers vying for equal footing with straightforward political, theological and economic discourses. On closer inspection, however, they are unequal: messages moving from the street upwards have a rebellious aim, those moving from the ad space down have a much more sinister source.' This particular observation developed the grounds for focusing my research problem: Socio-political graphics commissioned by political and activist groups are communicated through mass media, thus offering the impression that their statements are parallel to those of the general public. In reaction to that, the public is initiating low budget response graphics that communicate opposite messages. So the aim of the research would be to study the aspects of each one of these two categories of socio-political graphics in response to the following research question: What are the differences between the communicative aspects of socio-political graphics commissioned by official establishments, and those self-initiated by protesters? Now that the aim of the study is clear and the research question is conceived, it is possible to move on with the research design. The next chapter will study the context that revolves around the research question, and this will help in specifying the appropriate location, time period, and survey method for the plan. |
||||||||||||||
|
|||||||||||||||
 |
|||||||||||||||
|
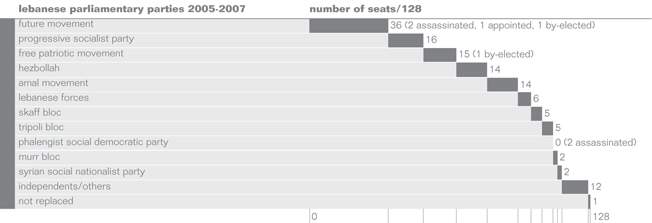
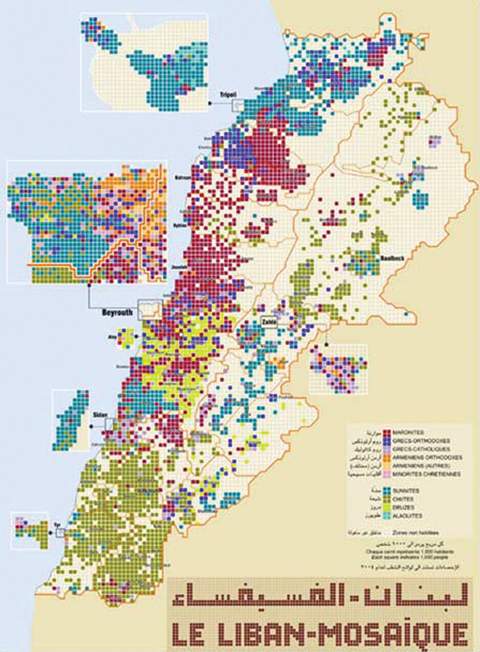
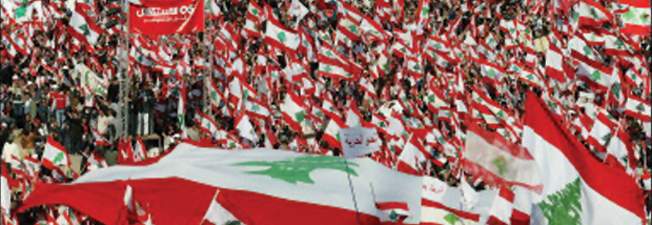
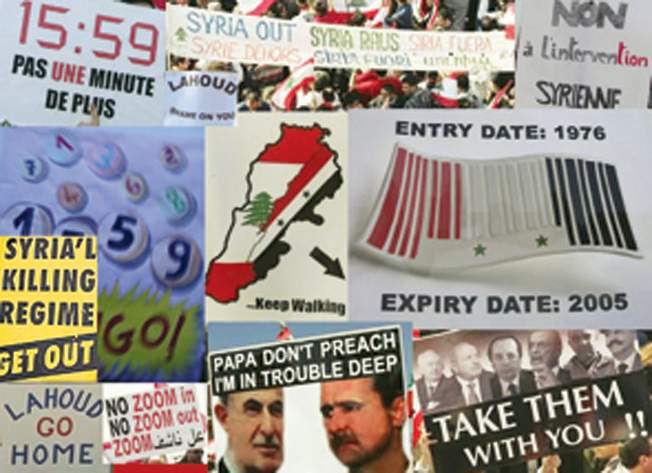
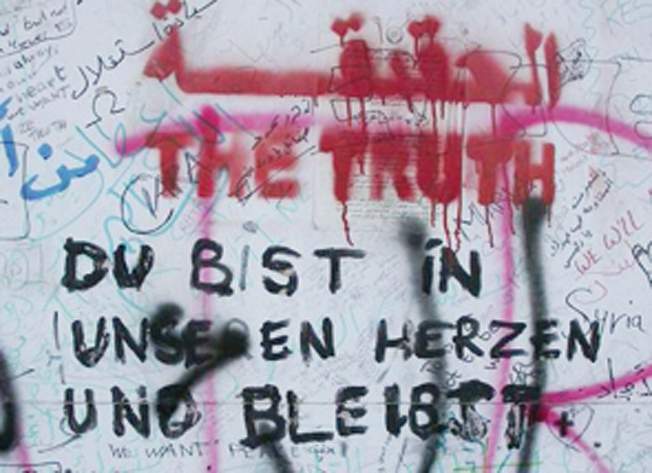
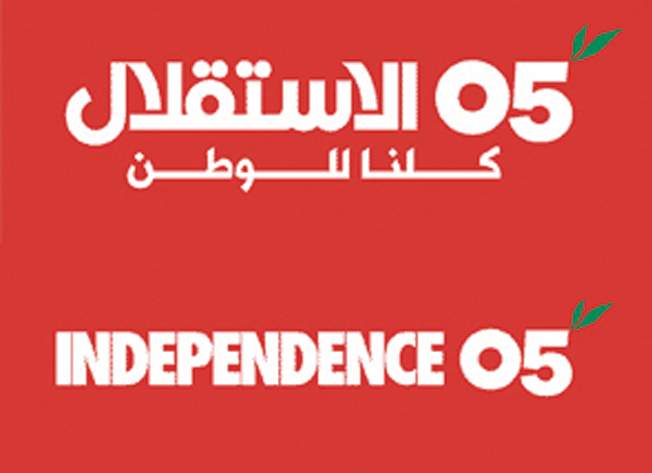
It is crucial that a researcher be informed of the culture behind the socio-political graphics he/she is planning to collect. 'Methods do not work in isolation; they depend on understandings of how meaning is made… All of these methods require some sorts of contextual knowledge about the imagery'.[31] On one side, the context will guide the researcher into interpreting the graphics from the correct standpoint as a spectator in the site of audiencing. Attempting to read the graphics without grasping the same knowledge as the original audience will most definitely lead to misinterpretation. If the local audience of the graphics is informed of a historical cultural context for example, then the researcher must aim for that same information. On the other side, this background information will also help understand the origins of the work, how it is produced, and who is commissioning it. Thus aspects in the site of production can also be revealed from the context. Another benefit is that it allows a researcher to recognize the best locations for collecting the graphics relevant to the research question, and to specify the time period that the collected work should have been produced in. Oppenheim[32] emphasizes the importance of reviewing the context to verify the adequacy of a research design. 'To be meaningful, the limited topic… must be part of a wider conceptualization or theoretical framework (the literature review and conceptualization stages'. There are different methods for obtaining information on the context of a culture. Reviewing books on the ancient and contemporary history of the culture is very effective, and interviews with informed or dedicated organizations can also reveal up-to-date knowledge. Nonetheless, socio-politics is a very sensitive topic, and sources can be opinionated. Because neutrality can never be quite guaranteed, referring to different sources with varied standpoints will cover more ground and help guarantee that the results of the research are truly representative. 2.1.0 Overview The constitution proclaims Lebanon to be a parliamentary democratic republic although it follows a special political system known as confessionalism. This system is meant to distribute power as evenly as possible among different sects. Looking back at the chronology of sectarian diversity in socio-politics, it is evident that the Lebanese are torn with endless conflicts: Arab and West, Sunni and Shia, Muslim and Druze, Muslim and Christian, Israel and Lebanon, Palestine and Lebanon, Syria and Lebanon, etc. Not to mention the conflicts between political parties frequently changing strategical positions figure 23: Free Patriotic Movement, Future Movement, Lebanese Forces, Hezbollah, Progressive Socialist Party, Phalengist Social Democratic Party, etc. The 15 year Lebanese civil war (1975-1990) was a direct consequence of the failing democratic system. During the next 15 years from 1990 to 2005, Lebanon was in a constant struggle to recover from the devastations caused by the war. Just when everything was returning to 'normal' and Beirut was regaining its pre-civil war reputation as the economic, intellectual, commercial and touristy capital of the Middle East, a major turning point occurred. Former Prime Minister Rafiq al-Hariri, one of the most prominent political figures in Lebanon, was assassinated. That led to a long chain of public demonstrations, terror bombings and more assassinations for over a year, including the killing of Member of Parliament Gebran Tueni. In July 2006, war re-entered the history of Lebanon, it lasted for 34 days, caused devastating human and economic losses, and heavily polluted the Lebanese Mediterranean coast. After that came more terror bombings and the assassination of Member of Parliament Pierre Gemayel. In May 2007, conflicts rose between the Lebanese Army and Fateh al-Islam; a Sunni Arab Islamist group in the Naher al-Bared camp in the north of Lebanon. The fighting ended with capturing the camp's army in September. The summer of 2007 also witnessed dispersed terror bombings in addition to the assassination of Members of Parliament Walid Ido and Antoine Ghanem. A complete timeline of socio-political events that occurred in Lebanon between 2005 and 2007 can be found in Chapter 6 of Volume 2. 2.2.0 Social structure Dr. Adonis Bouhatab, the industrial collaborator for this research, has recently written a review on the book 'The Social Structure of Lebanon' by Safia Antoun Saadeh.[33] Bouhatab remarked that the book is 'most instructive, it clearly defines our social and political system, offers a complete model that is well documented and substantiated, explains our problems and recurring civil wars, and may forecast our difficulties in the coming months.' The study shows that the Lebanese society has been, during the Ottoman Empire, developing a structure based on a caste system that has been strengthened after the Lebanese Independence in 1943. The definition of a caste is a system restricted in five elements which delineate that: one, the castes are ranked from high to low, two, they are formed of endogamous groups where marriages are constrained within one caste and intermarriage between two castes is socially sanctioned, three, membership within a caste is determined by birth and is inherited and ascribed, four, the caste at the top is the largest numerically, and five, mobility is restricted and an individual can move up within a caste, and the caste as a whole attempts to move up in the system. The five elements coincide with the Lebanese social and political structure and it makes one realize that all the concepts that have been previously attributed to the Lebanese system, such as tribalism, feudalism, sectarianism, clan or classes, are incomplete models. This caste system clearly explicates the frequent rivalry among castes competing to take precedence in the Lebanese hierarchical ranking. The system started in Lebanon during the Ottoman Empire, which stratified castes according to occupation and then assigned ranks to the different religious groups. The Ottoman theocracy prohibited mobility, ascribed occupations and divided the cities into quarters representing specific guild corporations. Each quarter was self-contained with a bath, market, church or mosque, and gate that closed at sunset. Today, more than 400 years later, this division of castes according to religions groups is still roughly visible in the Lebanese demography figure 24. After the independence in 1943, the National Pact divided power between the two economically and numerically dominant castes at the time, Christian Maronite and Muslim Sunni, and ignored the rights of the other 15 or so castes, until the civil war erupted in 1975 to remind the government that the country is built on a caste structure. After the assassination of Former Prime Minister Rafiq el Hariri in 2005, protests demanded the election of a new parliament, and the hierarchical rivalry was revived figure 23: the political parties of Hezbollah and Amal unseated the traditional Shiite feudal families, the Lebanese Forces unseated the families of Eddeh and Chamoun and tried to eliminate the Frangiehs, and the Future Movement unseated most of the Sunni traditional leaders in Beirut. Although the Phalangists Party won a few seats, it seems like it is on its way out after two of its members were assassinated within two years of being elected, and after its leader failed recently in the by-elections. 2.3.0 Specifying location This context affirms that to be truly representative of Lebanese socio-politics, a sample must include all the different 'castes' of the social structure. Since these castes, according to recent demographic maps, are roughly defined by geographical location, then the survey needs to cover most of these locations. Beirut, the capital, is one of the few Lebanese cities that incorporate a mixture of different castes in one location. Thus, surveying from Beirut will provide a diverse sample, but it will not be exhaustive on its own. Inhabitants who live in Beirut are always interacting and intermixing with different castes, and so are likely to produce neutral and independent socio-political graphics that lack conservative or extremist opinions. To cover this gap, it will be essential to survey from locations that specifically encompass large populations belonging to only one caste. The inhabitants of these areas will generally be more conventional and strict in their views of socio-political issues. Examples are: Tripoli for Sunnis, Keserwan for Christian Maronites, South for Shiites, Shouf for Druze, etc. 2.4.0 Specifying time period According to the context, two major socio-political episodes marked the history of Lebanon following its Independence in 1943. The first is the Lebanese civil war from 1975 to 1990, and the second is the period after the assassination of Former Prime Minister Rafiq Hariri, which includes the reformation of the government, numerous assassinations and terror bombings, the July War and the conquest of Naher el Bared. This period started with the beginning of 2005 and continues to the present. It was during these two periods that socio-political graphics were at their utmost, because the situations required high degrees of protest on many levels. Therefore, it will be informative if the socio-political graphics gathered in this research cover one or both of these periods. The difficulty however arises with the first period, the civil war. Very few publications, if any, have attempted to document or analyse the history of Lebanese socio-political graphics, thus materials dating more than 30 years since the civil war have either vanished or are relatively difficult to locate. It was mentioned in the previous chapter that two researchers, Alya Karame and Zeina Maasri are collecting 'signs of conflict' from the Lebanese civil war, but since their research is being done at a doctorate level, they can allocate more time for the efforts of retrieving rare graphics. Hence, this research will focus solely on the second episode because it is still considered recent history. The socio-political graphics that will be collected should have been generated within the past three years starting from January 2005. The 14th of March 2005 was a most notable date in this episode because it recorded the biggest demonstration in the history of Lebanon with arguably over one million protesters figure 25. The demonstration revealed competent socio-political campaigns that were designed exclusively for the event figure 26. The Holy Spirit University of Kaslik even briefed students to design banners for the demonstration as part of the course. Street graphics, stencils and graffiti filled the walls of Beirut and Martyr's square figure 27. Everyone had something to write or draw. Alongside the rebellious graphics by individual designers and non-designers was the massive Independence 05 campaign figure 28, which included a complete branding strategy for every activism prop. The campaign was designed collectively by some of Beirut's top ad agency talents, and was treated like a new product that needed to be branded and fast. It was obvious that massive funding was supporting it. The aggregation of the demonstration in terms of socio-political graphics is that it disseminated their use as a communicative tool for both the establishment and the protest voices. This tool was widely exercised to confront every socio-political incident after that. Because the chosen period is contemporary and at the heart of globalization, the graphics may possibly, alongside national politics, cover global concerns. Issues such as ecology, drugs, LGBT and safe driving are recently gaining more and more popularity in Lebanon. The context review made it possible to learn about the national and socio-political identities in the culture, and specify the time period and locations worth exploring when collecting socio-political graphics for the research. The next chapter will describe different survey methods for starting the collection process, and will investigate the ones suitable for the purpose of the case study. |
||||||||||||||
|
|||||||||||||||
 |
|||||||||||||||
|
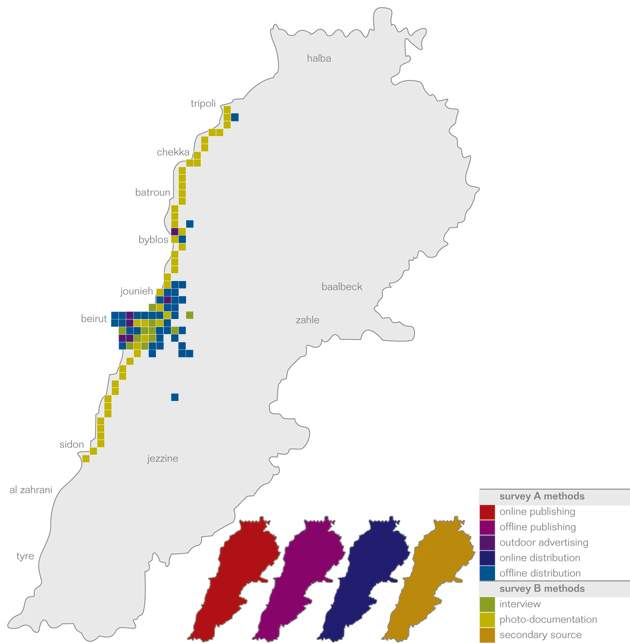
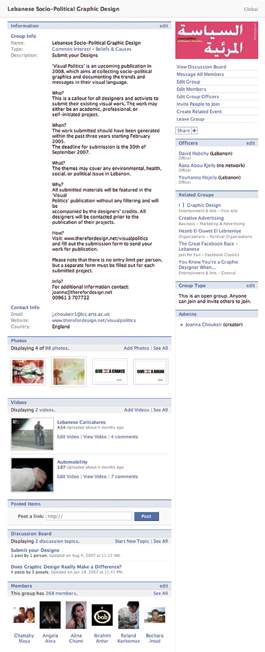
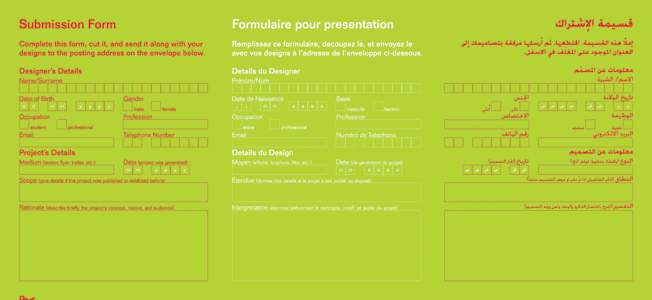
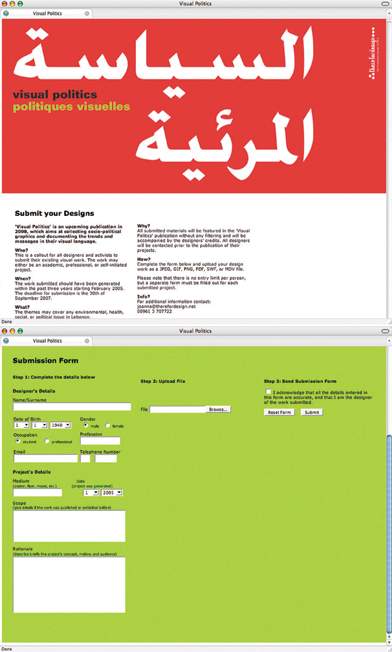
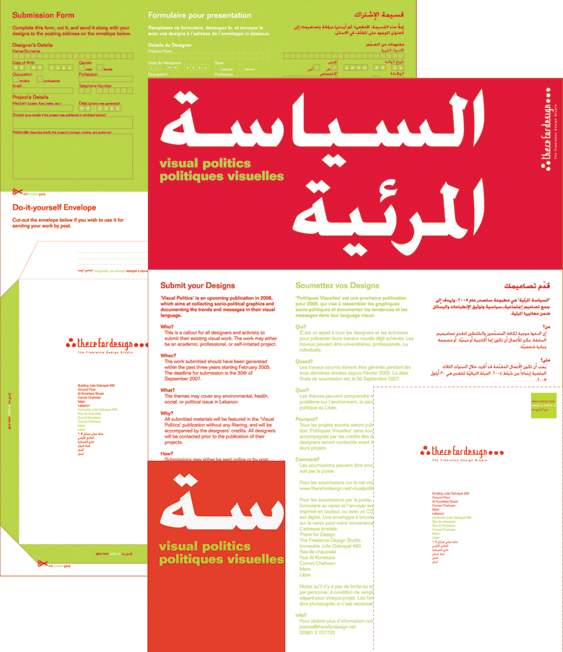
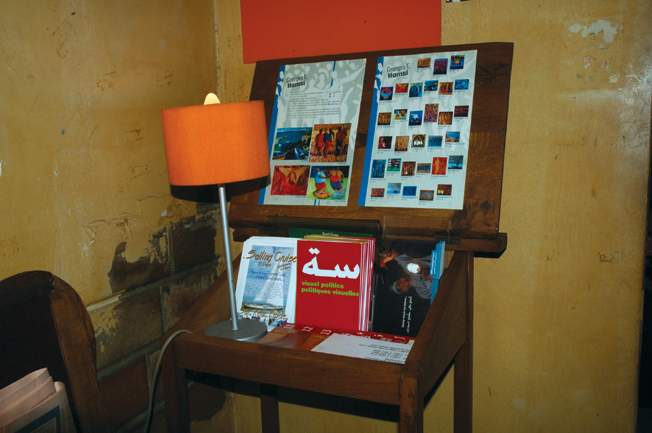
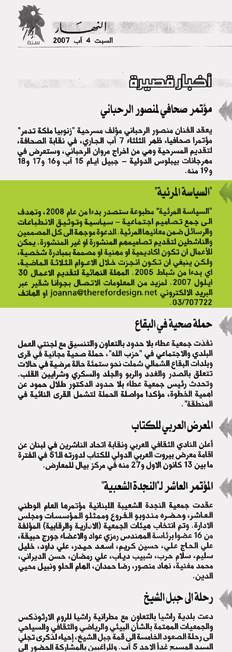
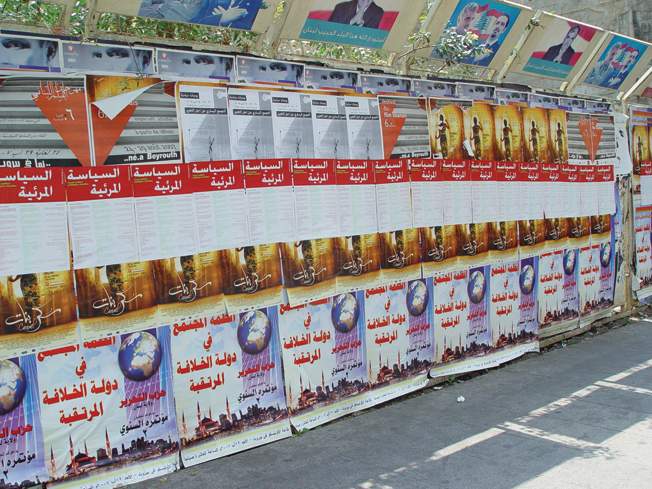
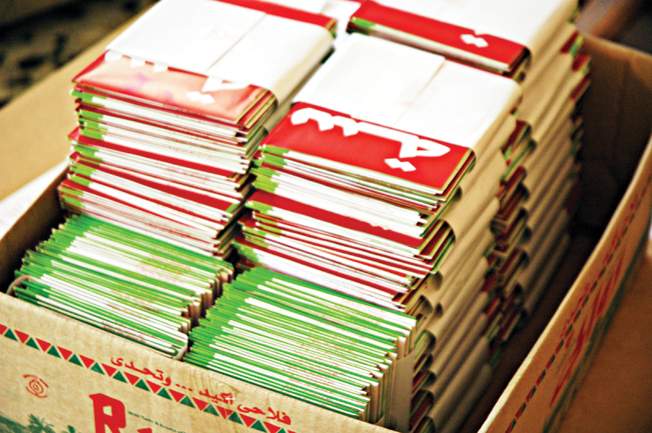
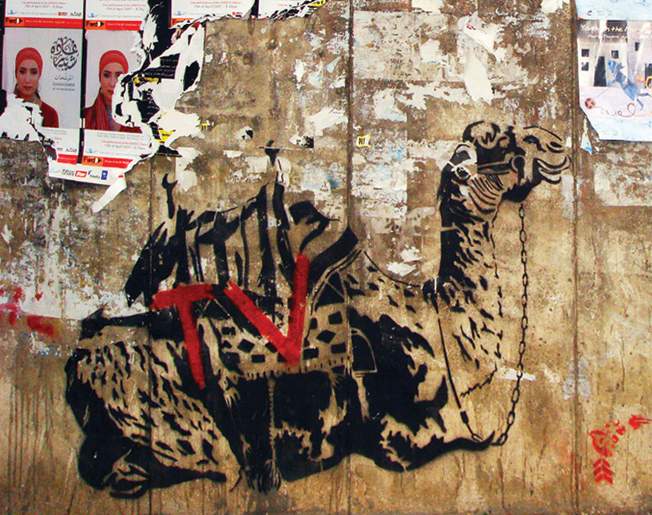
As with all methodologies, the socio-political graphics selected for analysis must be appropriate to the research question. Additional strictures in building the survey need to be considered with this type of methodology more than any other, because it is based on a quantitative study at the secondary stages, which means that its strengths lie in the large datasets. Rose[34] cautions against using quantitative methods on non-representative surveys. She says that quantitative studies require a collection of images that are both representative and significant. They should address all the images relevant to the research question. This does not necessarily entail examining every single relevant image, but the survey plan needs to be consciously designed. Oppenheim[35] states that a successful survey design allows every single relevant case in the study to have a non-zero probability of being included in the sample. Furthermore, this methodology relies on qualitative methods as well for discourse analysis, thus gathering graphics will not be sufficient on its own, information on the sites of production and audiencing of every graphic need to be uncovered. Therefrom, the three main steps in planning a survey are: One, listing the information that the survey needs to gather, two, choosing the appropriate survey method(s), and three verifying that the survey size is representative. The following sections will go through each of these in detail. 3.1.0 Information It is very important to underline from the beginning the information that needs to be gathered during the different survey methods, because once the graphics are collected and the researcher finds that his/her analysis contains missing information, there is no turning back. Even though it may be costly and time-consuming, it is always better to gather more information rather than less. If during the advanced stages some of the data proves insignificant, then it may be discarded. This process is indispensable for the discourse analysis at the sites of production and audiencing. It is also helpful for the site of the image itself, to facilitate coding at later stages. The kind of information that ought to be listed is entirely hypothetical. The researcher should be able to presume roughly which data would be purposeful for answering the initial research question. Rose[36] provides a detailed list of questions on the three sites, as a guide for choosing the relevant information. These are summarized below to try and facilitate the complexities of this process. Site of Production Site of the image Site of audiencing During the case study, these questions were reviewed, rearranged, and re-edited to suit the problem. The initial research question was how commissioned and self-initiated socio-political graphics differ in Lebanon. So the information questions were formulated around a hypothetical assumption of all the possible factors that may cause these two categories of socio-political graphics to diverge. Furthermore, the questions were narrowed to reveal straightforward, accessible and impartial information. As an example, the question 'who is the audience' was replaced by 'what is the technology of circulation' which yields a factual rather than conjecturable answer. Then, from the circulation method, information is acquired on how broad the audience spectrum is. The ultimate aim was to focus the sites of production and audiencing questions so that they result in factual answers from discourse analysis, and allow personal interpretation only in the site of the image questions, because this site will follow the controlled process of content analysis. The following are the final revised questions before moving on to choosing the survey methods. Site of production Site of the image Site of audiencing 3.2.0 Methods Oppenheim[37] refers to this step as choosing the techniques 'used for data generation and collection.' Should the graphics and information be gathered from questionnaires, interviews, photo-documentation or secondary sources? Each method yields a different category of graphics, so it is important to differentiate between the graphics that the method can pick up, and the graphics that the research needs. The following are some survey methods for socio-political graphics, with a concise description of each: Questionnaire This term has been used in many ways, but in this context it indicates the form that is distributed to designers to fill-out and send along with reproductions of their socio-political graphics. It is resorted to when there are no ways for retrieving the desired graphics other than approaching the makers themselves, and when the makers are either unidentified or too numerous for personal interviewing. This method differs from the common questionnaire in that it doesn't only collect data, but graphics as well. This creates bigger obstacles because it requires more effort from the audience, and thus yields lower response rates. There are several aspects that a researcher can consider to amplify response rates. Questions: A questionnaire is not 'a set of questions which have been casually jotted down without much thought'.[38] The questions should ask for the same data that was outlined in the information section previously. They can focus more on the information at the sites of production and audiencing and less on the site of the image, because interpretation at this site should be based on the researcher's observation, interpretation and understanding of the graphic within its cultural context. It is important to keep the questions brief, clear, friendly but serious. The ratio of closed to free-response questions is also crucial. Although closed questions are less time consuming to answer and are easier to code, free-response questions trigger answers that are more truthful. Credibility: A credible questionnaire will reveal the identity of the researcher, clarify its purpose to the audience, and guarantee their rights as owners of the graphics. Response methods: These can include online, postage, drop-box or personal collection. A successful questionnaire will adopt those that are most accessible and least time, cost and energy consuming for the target audience. Appearance: There are no hard rules on the appearance of a questionnaire as long as it avoids connotations to specific socio-political movements, and remains neutral, unbiased but inviting. Distribution and publicity: Offline distribution is based on a careful study of the most receptive locations for the target audience, and online distribution chooses the appropriate mailing lists. Publicity can also boost response rates if the advertisements are featured in the local media that attracts the specified audience. Quantity: In common questionnaires, a low response rate is around 20 percent. With this specific questionnaire, response rate can go as low as 10 percent even if the questionnaire was successfully distributed to the correct target audience. Hence, the quantity of questionnaires should be at least 10 times the anticipated number of responses. Before going ahead with implementing a full-scale questionnaire method, a pilot test should be tried out to test one or all of these different aspects for completeness. 'Pilot work is expensive and time-consuming, but avoiding or skimping it is likely to prove more costly still'.[39] Interview Interviews are very advantageous. Firstly, deciding to conduct an interview to collect socio-political graphics means that the researcher has identified an interviewee who will most definitely have significant materials to contribute to the research from his/her archives. The interviewee may be a member of a political party, social movement, academic institution, etc. In any case, a balance should be achieved when choosing the appropriate interviewees, so that the sources of the graphics are diversified in political standing. Another advantage to interviews is that unlike questionnaires, questions can be explained on a one to one basis in case of misunderstandings, to guarantee accurate answers. Again, the questions that need to be asked are those devised in the information section. Oppenheim states that interviews are a very solid method for gaining knowledge, but conducting a 'good' interview is a difficult skill. 'The interview, unlike most other techniques, requires interpersonal skills of a high order (putting the respondent at ease, asking questions in an interested manner, noting down the responses without upsetting the conversational flow, giving support without introducing bias)'.[40] Furthermore, like questionnaires, credibility is an important aspect of interviewing. The purpose of the study must be revealed to the interviewee, and the terms and conditions of the provided graphics must also be discussed. Photo-documentation This strategy can be helpful if the research aims at gathering graphics from the 'present'. Location of photo-documentation should be well considered according to the contextual studies done in the previous chapter. This method can either aim at outdoor advertising campaigns, or street graffiti, murals, stencils, etc. It does not only entail photographing the graphics, but also recording information on the site of audiencing. This can be retrieved from the location itself. However, this method does not work on its own because information on the site of production will be missing. In the case of outdoor advertising, interviews and reviews of secondary sources may reveal that information, but with street graffiti, knowledge of the site of production is very often lost, unless the artist is identified and interviewed. Another constraint that may apply to this method is if regulations forbid photography in the desired locations. Secondary sources Many publications can serve as periodical archives for socio-political graphics, but before a secondary source is chosen, the validity of its graphics should be verified, and unless this is the purpose of the research, the results will only be representing the content of the source instead of general facts. If one finds that the collection of graphics – from every single issue of the interrogated time period – is too overwhelming, then a sampling method may be applied. Weber[41] describes four efficient sampling methods. Random: Numbering the images and then using a random number table to choose a significant amount of images for the survey. Stratified: Choosing a fixed number of images from every subgroup. Subgroups may be chapters, issues, volumes, etc. The choice of which images to pick within each subgroup can also follow a sampling method. Systematic: Choosing every fifth, tenth, nth image. The cycle must not overlap with the periodical cycle of the publication. Cluster: Choosing random groups and sampling from them only. Articles, commentaries, and discourses that are related to the images must also be retrieved to answer the questions on the sites of production and audiencing. After reviewing these different methods, a researcher may find it necessary to rely on more than one for the purpose of the research, but there are often limitations when it comes to mixing graphics collected from various methods. Before doing so, the researcher needs to consider whether this mix interferes with the representativeness of the survey in terms of frequency and categorization. It is not possible to cover all the different possibilities where mixing methods is a relevant or irrelevant step, because each research question poses new problems and requires different standards. However, since the case study relied on mixing survey methods, then the following examination may provide a rough guide to the reasoning behind the mix. The purpose of the study on Lebanese socio-political graphics between 2005 and 2007 is to compare self-initiated and commissioned graphics. The term self-initiated means literally that the commissioner and designer of the work are the same person/group, while commissioned means that they are two different persons/groups. Commissioned graphics are generally supported by a budget from the commissioner, and enjoy a higher circulation exposure than self-initiated graphics. Thus, it is lucid to suggest that the sources of the two differ compellingly. This implies that different method strategies are required to build the survey. I will call these 'survey A methods' and 'survey B methods' figure 29. Both were executed in July and August 2007. 3.2.1 Survey A methods The following methods were adopted to collect self-initiated socio-political graphics. Questionnaire The questionnaire was done because this category of graphics is usually unseen beyond the proximity of the designers themselves. As an initial step, a pilot test was launched, and it took the form of an online group figure 30 on a community website that is popular in Lebanon, to verify if self-initiated graphics are abundant and substantial enough for analysis. The group invited all the Lebanese members of the community website who are either professionals or students in the creative, social or political domains, to upload their existing socio-political graphics on the group's album. The group also requested that they include personal details about themselves and the graphics such as: name, age, gender, occupation, rationale, date of generation and scope (published, exhibited, etc.) In a couple of weeks, the group had become quite popular for the Lebanese community, and around 70 graphics were uploaded. In spite of this, there were flaws in the pilot test. To begin with, it only targeted Internet users, and specifically members of the community website. Another flaw is that the majority of the members in this community are youths, so the survey was not attracting any middle-aged or elderly participants. A third defect is missing information. Many members were uploading graphics without including the requested information, and that makes analysis rather impossible because knowledge about the sites of production and audiencing is omitted. The questionnaire needed to have broader response methods, circulation and distribution. It also needed to be more credible and disciplined. So a second questionnaire, 'Visual Politics', was carfefully planned. Questions: The questions figure 31 were paraphrased from the assembled list of information. They focused on the sites of production and audiencing. The site of the image was left for personal observation. Site of production Site of the image Site of audiencing The questions were divided into two sections: designer's details and project's details. There was a 50/50 ratio of closed versus free-response questions. The closed questions were limited to factual or numerical answers such as: name/surname, date of birth, gender, occupation, email, telephone number and date (project was generated). The free-response questions allowed freedom for the designers to write about themselves and their work: profession, medium, scope (give details if the project was published or exhibited before) and rationale (describe briefly the project's concept, motive and audience). Credibility: This research was foreseen as a potential publication on Lebanese socio-political graphics, so to gain credibility, this was communicated in the questionnaire in addition to a text that explained: who should submit work (designers and activists), when should the work have been generated (2005 to 2007), what are the relevant themes (social and political), why should the work be submitted (for a potential publication, and all graphics will be credited), how should the work be submitted (online and by post), and contact details for further information. For additional credibility, the logo of my freelance design studio 'There for Design' was included on the questionnaire, so the audience can identify with the group responsible for the research. Response methods: The questionnaire relied on two response methods. The first was an online website figure 32, which can be visited on: www.therefordesign.net/visualpolitics. The website allowed the audience to complete an online submission form, and upload their graphics. To guarantee that all other information is filled in, the form was conditional, i.e. it cannot be submitted with empty fields. After submission, the form is automatically emailed to my address along with the graphics. The second method was a poster/flyer figure 33. A sample is available as an insert in Chapter 1 of Volume 2. The recto explained all the background information, and the verso had a cut-out submission form and DIY envelope. The audience may either choose to note down the website address and submit online, or cut out the submission form and envelope on the verso, and post it to my address along with printouts of the work. Appearance: The identity of the questionnaire relied simply on the Lebanese national flag colors: Red, green and white, because almost all the other primary and secondary colors had connotations to Lebanese social or political groups. The layout was straightforward with a three-column grid to accommodate translations in three languages: English, French and Arabic. This adapted fully to the Lebanese tri-lingual audience, and avoided misunderstandings if an individual isn't fluent in any one of these three languages. Distribution and publicity: The flyers were distributed around 32 outlets in the most populated cities in Lebanon, mainly between the coast and the western mountain range. Outlets consisted of design studios, colleges, bookshops, pubs, restaurants, galleries, theatres and shops; mainly places that attracted designers, activists, academics, etc. figure 34 A list of these can be found on the acknowledgements page. The location of outlets was chosen from the contextual studies of castes and their demographics, however, there were restrictions on distributing in the North and South due to the political instability of these areas. The questionnaire was also distributed through online mailing lists that constituted of 2000 to 2007 alumni in Graphic Design, Social Science and Political Science from Notre Dame University, The Lebanese American University and The American University of Beirut. These colleges are dispersed in the North, Jbeil, Shouf, Keserwan and Beirut, and attract students from various sects. As to publicity, an article about the questionnaire was published in An-Nahar, a leading Lebanese newspaper figure 35, and l'Agenda Culturel, a monthly magazine on cultural events. Furthermore, the posters were advertised on the public walls of main streets in Beirut figure 36: Hamra, Monot, Gemayze, Bliss, etc. Quantity: 1000 questionnaire flyers were distributed figure 37, and 2000 e-flyers were emailed, for a target of 200 submissions. Although planning and implementing the questionnaire was time and cost consuming, it proved to be a very successful method for collecting self-initiated graphics, and contributed to 90% of Survey A, with the other 10% from the initial pilot test. A few exceptions in submissions were not self-initiated, but commissioned by universities, colleges, or social organizations. These were removed from Survey A and placed in Survey B. Photo-documentation The second method for Survey A was photo documenting street graffiti figure 38. This failed for a number of reasons. The time that I was photographing coincided with the by-elections of August 2007, thus most walls were re-painted prior to elections, and a majority of graffiti were erased. This hinders the representativeness of the sample. Another reason is that graffiti was the focus of Patricia Barakat – el Asmar's research, and she managed to limit it to a specific location (Martyr's Square) and short time period (March to June 2005). The period for my research is approximately three years, and what remains of the graffiti has been damaged with time thus affecting meanings at the site of the image. Furthermore, it was practically impossible to retrieve any information on the site of production. For these stated reasons, the medium of Graffiti was exempted from Survey A. 3.2.2 Survey B methods The following methods were adopted to collect commissioned socio-political graphics. Interview The major commissioners of Lebanese socio-political graphics were identified from the contextual studies, and they incorporate six political parties, and five social activism groups. The political parties include both government allies (The Future Youth Movement, The Lebanese Forces, The Lebanese Phalanges) and government opposition (The Free Patriotic Movement, Hezbollah). Activism groups deal with ecology (Greenpeace), drug awareness (Oum el Nour), LGBT (Helem) and health and safety (YASA, The Red Cross). Each group was contacted, informed of the research purpose, and interviewed. The interview questions were the same as the questionnaire questions, and each commissioner was asked to provide, from the archives, graphics of previous campaigns done in 2005, 2006, and 2007 figure 39. Photo-documentation This method aimed at collecting evidence of all outdoor advertising related to socio-politics during July and August 2007 figure 40. The documentation took place along the main coastal highway of Lebanon, starting from Tripoli in the North and ending with Sidon in the South. Secondary sources and interviews were referred to for information on the site of production. Secondary sources Arab Ad, a monthly magazine that compiles all the mass campaigns in Lebanon and the Middle East, proved helpful for gathering socio-political campaigns before July 2007 figure 41. Every socio-political campaign from the January 2005 to the June 2007 issues was collected along with the complementary articles. Articles were reviewed to answer questions on the sites of production and audiencing. No sampling methods were required because the quantity of campaigns was acceptable. Three survey methods were needed to gather a substantial amount of commissioned graphics, and each one of them contributed to the survey. One method would not have been sufficient on its own. Graphics from these three methods can be mixed because they all belong to the same category of commissioned graphics. It would not be wise to mix Survey A and Survey B together, because wrong interpretations can result from frequency analysis. Thus each survey needs to be interpreted separately with respective percentages. This is because self-initiated graphics are more abundant but discreet, while commissioned graphics are fewer but massively circulated. However, and surprisingly, these two factors created a balance in the case study, and Survey A and Survey B methods ended up collecting approximately equal numbers of graphics, totaling to 195. This made it possible to mix the two surveys into one, and abandon the percentage studies. The mix still allows self-initiated to be differentiated from commissioned, because the information is recorded at the site of production. 3.3.0 Size Every single graphic collected from the different methods must be included in the survey. One of the main fallacies of analytical design is what Edward Tufte[42] calls 'cherry-picking'. This refers to the act of objectively picking out elements from the survey based on personal preference, or as a way of imposing a particular point of view or hypothesis. Another inappropriate tendency when it comes to visual materials is picking the graphics that are more 'aesthetic'. Excluding graphics that are not visually compelling is not a valid excuse, and the only case where omitting still gives a representative content is when the graphics are irrelevant to the research in terms of production date or subject for example, or when the survey size is very large. In such cases, involuntary random sampling is the best option to consider. So after collecting a survey and verifying that it is representative in content, the task now is to verify that it is representative in size. 'Common sense suggests that a larger probability sample will give a better estimate… than a smaller one, but will also be more costly. Yet the size of a sample, is in itself, not very important. A sample's accuracy is more important than its size'.[43] Rose talks about a different issue when dealing with survey size; the practical considerations. 'The sample should not be so large that it overwhelms the resources… available for analysing it'.[44] With a survey size of 195, and at least 10 answers regarding each graphic, this proliferates into 1950 pieces of data. Taking into account the large amount of information and the short period of time allocated for interpretation and analysis, the survey size is more than enough in terms of practical consideration. In addition, I decided to exclude all the animated materials (movies, websites, trailers, etc.) from the survey, and concentrate on static graphics, because interpreting animated graphics at the site of the image needs elaborate and prolonged techniques in terms of colors, background music, and voice over. So for the sake of time, these were compromised and the survey size dropped to 180. Nonetheless, it is safe to conclude that despite its size, the survey is still accurate because the collection methods have been thoroughly developed. Building a significant and representative survey poses new complications. How can a researcher avoid the confusion caused by such a sizeable amount of graphics and information? This will be the subject of the following chapter. It will explain how coding systems can organize information to facilitate interpretation. |
||||||||||||||
|
|||||||||||||||
 |
<< Methodology [1/3] | Methodology [3/3] >> Joanna Choukeir
|
||||||||||||||
|
©////o/ |
||||||||||||||
|
|